


The Three Outside Down is a three-candle trend reversal pattern that appears on the candlestick chart after a bullish rally. Three Outside Down is formed by three candles formed consecutively indicating that the current upward trend has lost momentum and a trend reversal can occur. The Three Outside Down candlestick pattern is formed at the peak of an uptrend and indicates a bearish reversal. Traders use this pattern for finding potential opportunities to sell assets as it indicates a sudden upcoming downfall in the price of assets.
The Three Outside Down pattern is formed when the first candle is a long bullish candle, followed by a smaller bearish or bullish candle that opens higher but closes lower than the previous candle. The third candle is a long bearish candle that closes below the midpoint of the first candle.
The Three Outside Down pattern suggests that the buyers, who were in control of the market have lost their momentum and the sellers have taken over. Traders can use this signal to sell their positions or enter a short position in the market.
The Three Outside Down patterns occur frequently and are reliable indicators of a reversal. It is also easy to spot on a candlestick chart making it accessible to both novice and experienced traders.
The Three Outside Down pattern is not always accurate and should not be relied on solely. The pattern can also be subjective as different traders can interpret the formation differently. Traders should always use other technical analysis tools and fundamental analysis to confirm their trading decisions. The Three Outside Down pattern can not be as effective in markets with low volatility or during periods of economic uncertainty.
What is the Three Outside Down candlestick pattern?
The Three Outside Down candlestick pattern is a bearish reversal pattern that occurs during an uptrend in the market. The Three Outside Down consists of three candlesticks where the first candle is a green bullish candle, followed by two red bearish candles.

The three-outside down pattern is a triple candlestick patterns and typically follows a negative trend. These candles always show whether or not a trend reversal is about to occur.
The first candle is a green bullish candlestick that typically closes near the high of the day, this candle indicates the dominance of the bulls in the market. The green candle represents the current uptrend in the market. The second candle is a red bearish candlestick that opens above the previous day’s high and closes below the previous day’s low.
The second candle completely engulfs the first bullish candle and acts as a turning point in the current trend of the market. This candle Indicates that the market is now being controlled by the bears and they are pushing the price down. The three outside down pattern is formed at the top of an uptrend as shown in the chart below.
How is Three Outside Down Candlestick Formed?
The most important condition for the formation of the Three Outside Down candlestick pattern is that the market should be in an uptrend, which means that the price of the particular should be increasing over a given period. The initial candle formed is white/green indicating an uptrend. This indicates the initial position of the market at which it is dominated by the buyers.

The next candle of this pattern is formed when the bulls have lost momentum and the bears have taken control of the market. The second candle is a large black/red candlestick that completely engulfs the first candlestick.
The third candle must also be black/red because it represents the final candle of three outside down. This candle should finish higher than the second candle. This demonstrates how the uptrend tendency of a particular asset is shifting.
The below image shows the formation of the Three Outside Down candlestick pattern, this pattern is formed when the above-mentioned three candlesticks appear on the chart consecutively.
The first candle signifies the end of the prevailing bullish trend as the second bearish candle completely engulfs it. The third candlestick marks the beginning of a new bearish trend.
The three outside down pattern is a reliable sign of a reversal because it has a higher success rate when compared with other indicators. This pattern can be used by traders for their main purchasing or selling signals, but they should still keep an eye out for additional chart patterns or technical confirmations.
What does Green Three Outside Down Candlestick tell?
The Green Three Outside Down candlestick pattern is a bearish reversal pattern that suggests a potential trend reversal from an uptrend to a downtrend.
The Green Three Outside Down Candlestick is a type of Three Outside Down pattern that occurs when the first candlestick is bullish.
The first candle of the Green Three Outside Down pattern is a bullish candle, which means that the closing price is higher than the opening price. The length of this candlestick can vary and it plays a significant role in the pattern. It is essential to note that the larger the bullish candle, the more significant the potential trend reversal.
The second candlestick is a bearish candlestick, which means that the opening price is higher than the closing price. This candlestick’s high should be higher than the previous day’s high, while the low should be lower than the previous day’s low. This implies that the bears have taken control of the market and are pushing the price down.
The third candlestick is also a bearish candlestick that opens below the previous day’s low and closes even lower. This candlestick confirms that the bears are in control and that the uptrend is reversing.
How Important is the Color of the Three Outside Down Candlestick?
The Color of the Three Outside Down Candlestick is highly important as it plays a crucial role in determining its reliability and the strength of the trend. A bearish candle is represented by a red or black body, while a bullish candle is represented by a green or white body. The first two candles must be bullish (green or white), while the third candle must be bearish (red or black) in the three outside down patterns.
The colour of the third candle in the three outside down pattern is important because it represents a shift in the market sentiment from bullish to bearish. It signals that the sellers have taken control and are likely to drive prices lower when the third candle is bearish and closes below the low of the second candle. This is because the bears have managed to push prices below the previous low, indicating that the momentum has shifted in their favour.
The pattern is not considered valid and is less reliable in case the third candle is not bearish and does not close below the low of the second candle. It is necessary that the first candle in the Three Outside Down Candlestick should be green (bullish) followed by two consecutive red (bearish) candles.
When does Three Outside Down Candlestick happen?
The Three Outside Down Candlestick pattern typically occurs during an uptrend when the market has been experiencing bullish price action but it can also occur after a period of consolidation or sideways trading.
The three outside down candlestick pattern occurs when there is a shift in market sentiment from bullish to bearish. The three outside down candlestick patterns can occur in any time frame, from intraday charts to monthly charts. It is more reliable on longer time frames such as daily or weekly charts, where it can signal a major trend reversal.
The pattern is also more reliable when it occurs after a prolonged uptrend and at a key resistance level, as this indicates that the buyers are exhausted and that the sellers are ready to take over. Traders and analysts use the pattern to identify potential entry points for short trades or to close out long positions.
How often does Three Outside Down Candlestick occur?
The frequency with which the three outside down candlestick pattern occurs can vary greatly depending on the market and the time frame being analysed. The three-outside down candlestick pattern is a relatively rare occurrence in technical analysis, but it can be a powerful signal for traders when it does appear.
The pattern can occur more frequently in volatile markets where prices are fluctuating rapidly, such as in the cryptocurrency or foreign exchange market. The three outside down candlestick patterns can occur more frequently on shorter time frames, such as hourly charts, where there are more opportunities for price movements.
How to read Three Outside Down Candlestick in Technical Analysis?
It is important to first understand the basic components of a candlestick chart to understand how to read the three outside-down candlestick patterns in technical analysis. Each candle on a candlestick chart represents a single period, such as a day or an hour, and consists of a body and wicks or shadows. The body represents the opening and closing prices for the period, while the wicks or shadows indicate the high and low prices for that period.
Traders should look for the following five characteristics to confirm the validity of the pattern.
- The pattern should occur after a prolonged uptrend.
- The second candle should have a smaller body than the first candle.
- The third candle should be a bearish candle that closes below the low of the second candle.
- The pattern should occur at a key resistance level or after a price run-up.
- The volume should increase on the third candle.
The pattern is considered valid and traders can take a short position in the market when these characteristics are present in a chart during a particular time frame.
Traders while doing technical analysis should also pay attention to the context in which the pattern has formed in addition to confirming the reversal signal. The reversal signal can be less reliable if the pattern occurs in a volatile market than if it occurs in a stable market. The reversal signal can be less reliable in case the pattern occurs at a key support level than if it occurs at a key resistance level.
How accurate are the Three Outside Down Candlesticks in Technical Analysis?
The accuracy of any candlestick pattern in technical analysis depends majorly on three factors such as the strength of the trend, the time frame of the chart being analysed, and the volume of trading. The Three Outside Down pattern is considered to be a reliable bearish reversal pattern when it appears at the end of an uptrend. The pattern indicates that the bullish trend is losing momentum and that the bears are gaining control of the market.
One of the key factors that can affect the accuracy of the Three Outside Down pattern is the strength of the trend. The pattern is more likely to be accurate as it indicates a significant shift in market sentiment during a strong uptrend. The pattern can not be as reliable and the bears can not have enough momentum to push the market into a downtrend in case of a weak uptrend.
Another factor that can affect the accuracy of the pattern is the time frame of the chart being analysed. The pattern is more reliable on higher time frames such as daily or weekly charts as they provide a clearer picture of market trends and are less affected by market noise. The pattern can not be as accurate as they are more prone to false signals and can not provide a clear indication of market sentiment on lower time frames such as hourly or 15-minute charts. It is therefore better to use this pattern for longer time frames to avoid false signals.
When is the best time to Trade using Three Outside Down Candlestick?
The best time to trade using the Three Outside Down Candlestick pattern is when it appears at a key resistance level or a significant Fibonacci retracement level. Fibonacci retracement levels are commonly used by traders to identify potential support or resistance levels based on Fibonacci ratios, which are believed to occur naturally in market movements
This indicates that the market has reached a level of exhaustion and is likely to reverse. The Three Outside Down pattern should be confirmed by other technical indicators such as the Relative Strength Index (RSI) or Moving Average Convergence Divergence (MACD) indicator.
The pattern could suggest that the retracement is over and the trend is likely to resume its original direction if the Three Outside Down pattern appears at a significant Fibonacci retracement level.
How to Trade with Three Outside Down Candlesticks in the Stock Market?
First we need to know the steps involved in finding this pattern for trading using the Three Outside Down Candlestick Pattern in the Stock Market. Following are four fundamental steps to identify this pattern in the Stock Market:
- Identify the Three Outside Down pattern: Traders should look for a bullish candlestick followed by a larger bearish candlestick that engulfs the previous candlestick. The third candlestick should be bearish and close below the low of the second candlestick.
- Confirm the pattern: Traders should look for confirmation of the pattern by checking other technical indicators such as the Relative Strength Index (RSI), Moving Averages, and volume.The third candlestick should be another bearish candlestick, which closes below the second candlestick’s low.
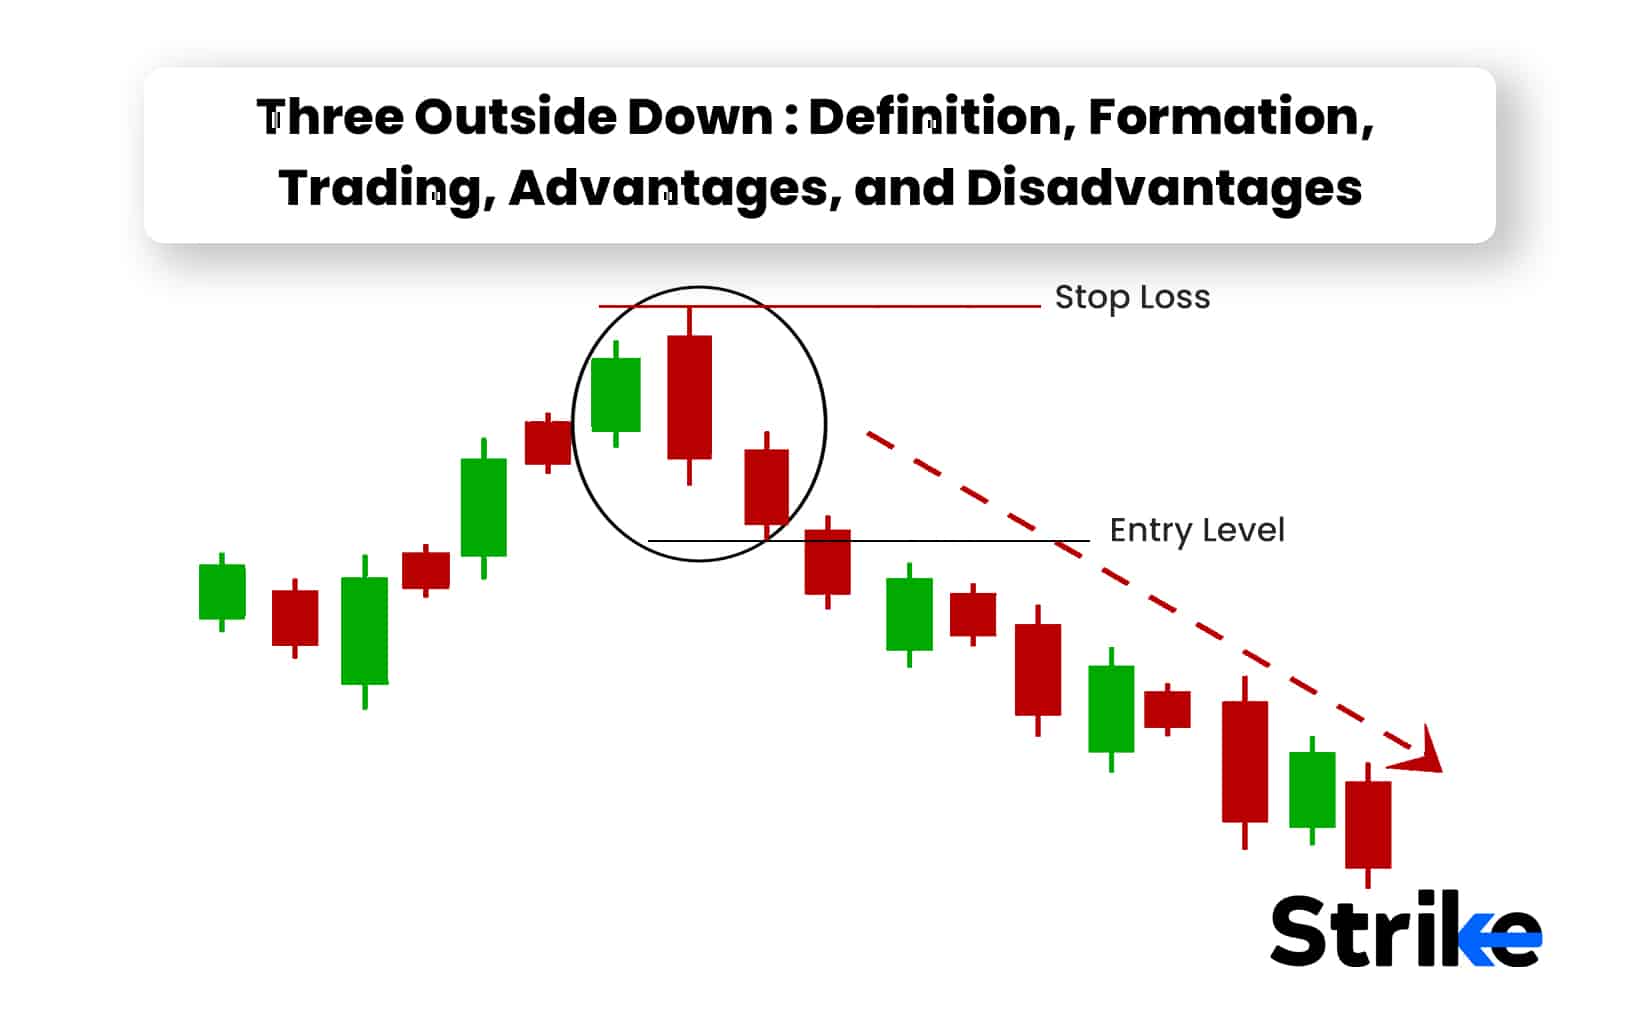
- Place a Sell order: Once traders have identified and confirmed the Three Outside Down pattern, They should consider placing a sell order below the low of the third candlestick. This provides a clear entry point for a short trade.
- Set stop loss: A stop loss should be placed above the high of the pattern. This helps to limit potential losses in case the trade goes against the traders will.
Trading involves risks and it is important to have a solid trading plan, risk management strategies, and discipline to succeed in the stock market. Traders should not only rely on a single candlestick pattern and they should also consider other factors like past performance, news and market conditions for making decisions.
Where is the Three Outside Down commonly used?
The Three Outside Down is a bearish candlestick pattern that is commonly used in the technical analysis of financial markets. It is typically used to identify a potential reversal in an uptrend and is found in charts of various financial instruments such as stocks, currencies, and commodities.
Traders and analysts often use the Three Outside Down pattern in conjunction with other technical indicators and analysis techniques to gain insights into market trends and to make trading decisions. The pattern is considered to be a reliable indicator of a potential trend reversal, especially when it occurs after a sustained uptrend.
Is the Three Outside Down in an Uptrend a Sell Signal?
Yes, the Three Outside Down pattern in an uptrend is generally considered to be a bearish signal and a potential sell signal. It suggests that the buyers who were in control during the uptrend are losing momentum, and the sellers are taking over, leading to a potential reversal in the trend. This means that the price of the security which was earlier increasing because of the uptrend will now decrease because of the downtrend. The value of the shares owned by the traders might decrease causing unnecessary losses. The Traders should consider Three Outside Down in an uptrend a sell signal to avoid such a situation
What are the advantages of the Three Outside Down Candlestick Pattern?
The Three Outside Down Candlestick Pattern is widely used in technical analysis, because of its huge number of advantages as compared to other technical analysis tools. The following are four major advantages of the Three Outside Down Candlestick Pattern:
- Strong signal for trend reversal: The Three Outside Down pattern is a strong indication of a trend reversal as it represents a shift in market sentiment from bullish to bearish. The pattern is formed when the buyers are in control of the market initially but then lose momentum, allowing the bears to take over and push prices lower.
- Confirmation of market weakness: The Three Outside Down pattern confirms that the market is weakening, and there is a higher likelihood of a downward trend. The pattern indicates that the bears are gaining control and pushing prices lower, which can be useful for traders who are looking to enter short positions.
- Provides clear entry and exit signals: The Three Outside Down pattern provides clear entry and exit signals for traders. Traders can enter short positions when the pattern is confirmed, and exit their positions when prices reach a predetermined level or when a bullish reversal pattern is identified.
- Can be used in combination with other technical indicators: The Three Outside Down pattern can be used in conjunction with other technical indicators such as moving averages, oscillators, and support and resistance levels to increase the accuracy of the trading signals.
The Three Outside Down pattern can be a valuable tool for traders in identifying potential entry and exit points in the trade and managing risk in their trading strategies.
What are the disadvantages of Three Outside Down Candlestick?
The Three Outside Down Candlestick pattern is a widely used pattern for technical analysis in the market, but it still has several disadvantages that should be considered before making trading decisions. The following are the five most common limitations of the Three Outside Down Candlestick Pattern:
- False signals: One of the biggest disadvantages of the Three Outside Down Candlestick pattern is that it can generate false signals. Sometimes the pattern appears but does not lead to a bearish trend reversal. Traders who rely solely on this pattern can enter the market at the wrong time and incur losses.
- Not always reliable: The Three Outside Down Candlestick pattern is not always reliable. The pattern can appear at the end of a temporary pullback rather than at the end of a trend reversal. Traders can miss out on potential profits In such cases if they exit their positions too soon.
- Requires confirmation: The Three Outside Down Candlestick pattern should not be used as a standalone indicator. It should be used in conjunction with other technical analysis tools, such as trend lines, support and resistance levels, and other candlestick patterns. Relying solely on this pattern can lead to missed opportunities or wrong trading decisions.
- Subjective interpretation: Candlestick patterns are subjective and can be interpreted differently by different traders. Some traders can see the Three Outside Down Candlestick pattern as a strong bearish signal, while others can not see it as significant. Traders should exercise caution when interpreting candlestick patterns and use them in conjunction with other technical analysis tools.
- Not suitable for all markets: The Three Outside Down Candlestick pattern can not be suitable for all markets or time frames. It is more effective in markets with high liquidity and trading volumes, such as the forex or stock markets. The pattern can not generate reliable signals in low liquidity markets or during periods of low trading volumes.
These limitations can affect the efficiency of the trading decisions, so to reduce the chances of failures the Three Outside Down pattern should be used with other tools and analysis methods.
What is the Opposite of Three Outside Down Candlestick?
The opposite of the Three Outside Down Candlestick pattern is the Three Outside Up Candlestick pattern which indicates a shift in momentum from bearish to bullish.
The Three Outside Up Candlestick pattern is a bullish reversal pattern that occurs at the end of a downtrend. It is characterised by a long bearish candlestick followed by two or more bullish candlesticks, where the closing price of each subsequent candlestick is higher than the one before it. The pattern indicates a shift in momentum from bearish to bullish and suggests that the bulls have taken control of the market.
What are other types of Doji Candlestick Patterns besides Three Outside Down?
Doji is a commonly found candlestick pattern in which the price of the asset closes and opens at the same point. Doji is represented with the help of a small candle having a relatively small real body on the charts. The shapes of these candles are then analysed by traders to make decisions about price movements. The Three Outside Down pattern is one of the Doji variations, following are eight types of Doji candlestick patterns that traders can use to make informed trading decisions:
- Gravestone Doji: The Gravestone Doji is a bearish reversal pattern that forms when the open, close, and low prices are the same or very close to each other, and the high price is significantly higher. This creates a long upper shadow that looks like a tombstone. The Gravestone Doji signals a potential reversal of an uptrend and a possible trend reversal towards a downtrend.
- Dragonfly Doji: The Dragonfly Doji is a bullish reversal pattern that forms when the open, close, and high prices are the same or very close to each other, and the low price is significantly lower. This creates a long lower shadow that looks like a dragonfly. The Dragonfly Doji signals a potential reversal of a downtrend and a possible trend reversal towards an uptrend.
- Long-legged Doji: The Long-legged Doji is a neutral pattern that forms when the open and close prices are the same or very close to each other, and the upper and lower shadows are long. This creates a long-legged appearance. The Long-legged Doji indicates indecision in the market, and traders should wait for further confirmation before making any trading decisions.
- Four Price Doji: The Four Price Doji is a rare pattern that forms when the open, close, high, and low prices are the same. This creates a small square or cross-like appearance. The Four Price Doji is a very rare pattern, and its occurrence indicates extreme indecision in the market.
- Northern Doji: The Northern Doji is a bullish reversal pattern that forms when the open and close prices are the same or very close to each other, and the high price is significantly higher than the low price. This creates a long upper shadow and a short lower shadow. The Northern Doji signals a potential reversal of a downtrend and a possible trend reversal towards an uptrend.
- Southern Doji: The Southern Doji is a bearish reversal pattern that forms when the open and close prices are the same or very close to each other, and the low price is significantly lower than the high price. This creates a long lower shadow and a short upper shadow. The Southern Doji signals a potential reversal of an uptrend and a possible trend reversal towards a downtrend.
- Ladder Bottom Doji: The Ladder Bottom Doji is a bullish reversal pattern that forms when the open, close, and low prices are the same or very close to each other, and the high price is significantly higher. This creates a long upper shadow and a small body with a long lower shadow. The Ladder Bottom Doji signals a potential reversal of a downtrend.
- Rickshaw Man Doji: The Rickshaw Man Doji is a neutral pattern that forms when the open and close prices are the same or very close to each other, and the upper and lower shadows are equal. This creates a cross-like appearance. The Rickshaw Man Doji indicates indecision in the market and suggests that traders should wait for further confirmation before taking any trading decisions.
These above-mentioned Doji candlestick patterns can be used with the volume indicators to get confirmations and identify potential reversals in the market.
What Candlestick Pattern is Similar to Three Outside Down Candlestick?
One candlestick pattern that is similar to the Three Outside Down candlestick is the Evening Star pattern. The Evening Star pattern is also a bearish reversal pattern that occurs at the end of an uptrend. It consists of three candles, with the first being a long bullish candle, the second being a small candle that can be either bullish or bearish, and the third being a long bearish candle.
The key difference between the Three Outside Down and Evening Star patterns is the size of the second candle. The second candle is smaller as compared to the previous bullish candle in the Three Outside Down pattern. The second candle can be either bullish or bearish and is typically small in the Evening Star pattern
The Evening Star pattern is also characterised by the bearish candle closing below the midpoint of the first bullish candle, indicating a significant shift in market sentiment from bullish to bearish.
Is the pattern of the Three Outside Down a bullish reversal?
No,the Three Outside Down is a bearish reversal pattern that signals a potential trend change from bullish to bearish. It suggests that the previous bullish momentum is slowing down when this pattern appears on a chart, and the bears are starting to take control of the market. Traders can as a result consider selling their long positions or entering short positions in anticipation of a bearish trend.
It is essential to understand the psychology behind it to better understand the significance of the Three Outside Down pattern. The first candle in the pattern is a long bullish candle, which shows that the buyers are in control and pushing the price up. The bears make their presence in the second candle by pushing the price down, and this candle opens above the previous day’s high, indicating that buyers can have attempted to push the price higher but failed.
The third candle confirms the bears’ dominance, as it opens lower than the previous day’s close and closes even lower. This indicates that the selling pressure is increasing, and the bears are gaining momentum, potentially leading to a more extended bearish trend. It is worth noting that the Three Outside Down pattern is more reliable when it appears after an uptrend or during a consolidation period, indicating a potential trend reversal.
What is the difference between Three Outside Down and Three Outside Up?
Three Outside Down and Three Outside Up are popularly used technical analysis tools in the financial markets, but both of them are opposite of each other.
The Three Outside Up pattern is a bullish reversal pattern that occurs after a downtrend. The pattern consists of three candles: the first is a long bearish candle, followed by a small bullish or bearish candle, and finally a long bullish candle that closes above the high of the first candle.
The second candle, also known as the “inside candle,” should have a smaller range than the first and third candles. The third candle should close above the high of the first candle, indicating a bullish reversal.
The Three Outside Down pattern is a bearish reversal pattern that occurs after an uptrend. Like the Three Outside Up pattern, it consists of three candles: the first is a long bullish candle, followed by a small bullish or bearish candle, and finally a long bearish candle that closes below the low of the first candle.
The second candle, or the “inside candle,” should have a smaller range than the first and third candles. The third candle should close below the low of the first candle, indicating a bearish reversal.


 Previous Article


 2026: Features, Pros vs Cons, Pricing, Reviews, Is It Worth It? 16")
 2026: Features, Pros vs Cons, Pricing, Reviews, Is It Worth It? 17")
 2026: Features, Pros vs Cons, Pricing, Reviews, Is It Worth It? 18")


 : Definition, Formula, calculation, Uses, Advantages Vs limitations 22")


No Comments Yet.