Aroon indicator is used to spot patterns in the price of a financial instrument and determine how strong those trends are.
Aroon indicator consists of two lines- the Aroon up line and the Aroon Down line. The Aroon up line counts the number of periods since the price was at its greatest point during a certain period, while the Aroon Down line counts the number of periods since the price was at its lowest point during that same time.
In between 0 and 100, the Aroon Up and Aroon Down lines change direction. A trend is stronger when its value is closer to 100, whereas a trend is weaker or nonexistent when its value is closer to 0.
The crossing of these lines can produce trading signals. The Aroon up line determines how many periods have passed since the time period’s peak. It provides information about the strength of the upswing by displaying the amount of time since the last high point. The Aroon Down line determines how many periods have passed since the lowest low within the same time frame, showing the amount of time since the previous low and offering details on the severity of the downtrend.
What is Aroon Indicator?
The Aroon indicator is a technical analysis tool used to recognize and measures the strength and direction of a trend in the price of a financial instrument. The Aroon-Up line and the Aroon-Down line are two individual lines.
The Aroon-Up line counts the number of intervals since the greatest price during a given time, and the Aroon-Down line counts the intervals since the lowest price within a given period. The duration can be changed based on the user’s preferences; however, 25 is normally the default term.

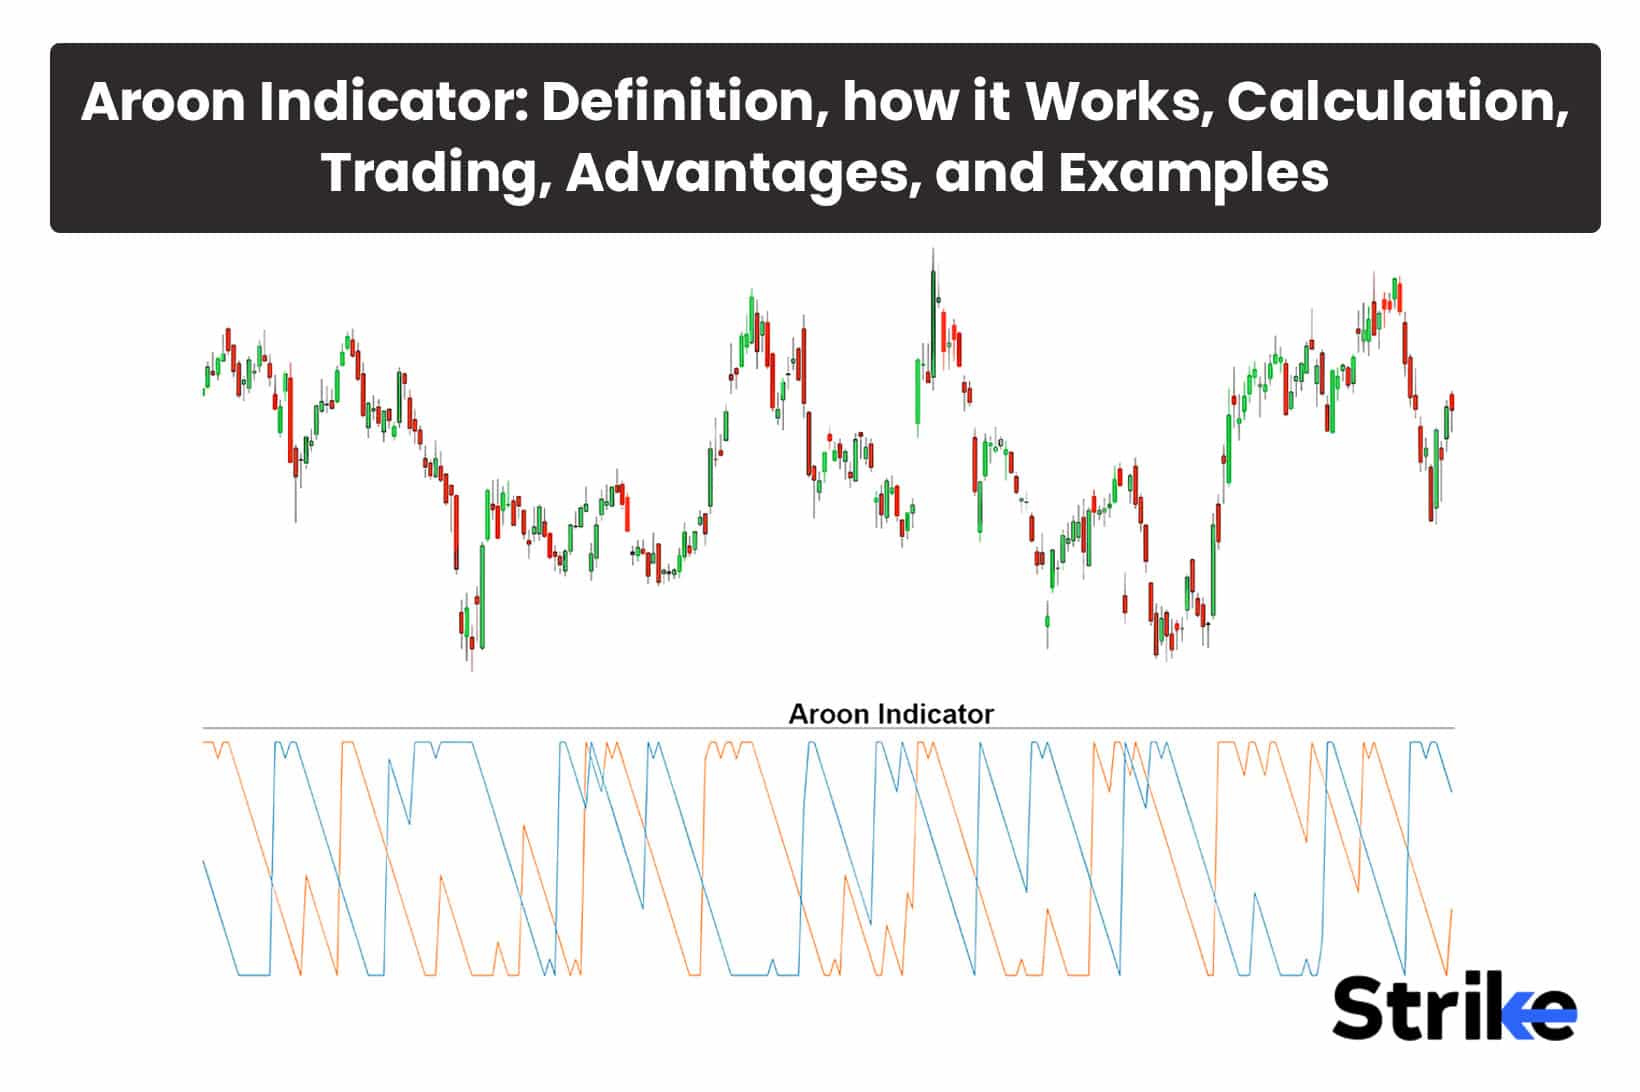
In the chart uploaded above, the orange and blue lines are respective Aroon-up and Aroon-down lines.
Aroon’s indicator swings back and forth between 0 and 100. The Aroon-Up line indicates that the price is going upward or experiencing upward momentum when it is closer to 100. On the other hand, when the Aroon-Down line is nearer to 100, it shows that the price is moving lower or is trending lower. The tendency is greater the closer the lines are near 100.
What is the origin of the Aroon Indicator?
Tushar Chande created the Aroon indicator in 1995. Author of several trading and technical analysis books, Tushar Chande, is a well-known technical analyst. He developed the Aroon indicator to spot trends and estimate their strength and longevity.
The name “Aroon” is derived from “Aruna,” which is Sanskrit for “dawn” or “early light.” Chande chose this term to communicate the idea of spotting the start of a new trend or the starting stages of a trend reversal.
Why is Aroon Indicator important in Technical Analysis?
The Aroon indicator acts as an important tool in technical analysis because Aroon indicator helps traders in recognizing and validating price movement trends. Traders can identify the existence of an uptrend or a downturn by examining the Aroon-Up and Aroon-Down lines. This information is critical for traders to align their methods with the current market direction. The Aroon indicator provides timely tips for trading entry and exit. The crossover signals and threshold levels of the indicator can be used by traders to open positions or close out profitable ones. Traders may improve their timing and their trades’ results by including the Aroon indicator in their research.
A key aspect of technical analysis is determining how strong a trend is. By counting the number of days that have passed since the highest peak (Aroon-Up) and lowest low (Aroon-Down), the Aroon indicator calculates the strength of a trend. Trading professionals may use this information to assess a trend’s strength and decide on their positions.The Aroon indicator aids traders in spotting probable trend reversals, which are important market turning points. Aroon-Up and Aroon-Down line crossovers can indicate an impending trend change, allowing traders to plan for anticipated market changes and modify their tactics appropriately.

The chart uploaded above is a Nifty50’s daily chart and Aroon indicator is applied with 25 periods.
The Aroon Indicator can be used with other indicators in order to assess the trend strength. It easily aligns with the other indicators.
Traders may acquire a thorough perspective of market trends, enhance their timing, and boost the likelihood of successful trades using the Aroon indicator in technical analysis.
How does Aroon Indicator work?
The Aroon indicator works by measuring the time that has passed from the lowest low (Aroon-Down) to highest high (Aroon-Up) within a predetermined time frame. The strength and timing of price changes are shown, enabling traders to spot trends and probable trend reversals.

Here is a step-by-step explanation of the Aroon indicator’s operation:
The number of periods that have passed since the maximum high during a certain period is used to compute the Aroon-Up line. The calculation for aroon-up is as follows:
Aroon-Up = ((Number of periods – Number of periods since highest high) / Number of periods) * 100
The number of periods since the lowest low within a given period is used to compute the Aroon-Down line. The calculation for Aroon-Down is as follows:
Aroon-Down = ((Number of periods – Number of periods since lowest low) / Number of periods) * 100
The Aroon indicator consists of two lines that oscillate between 0 and 100, the Aroon-Up line and the Aroon-Down line. Traders interpret the indication based on these lines’ relative locations and movements.
The Aroon indicator helps traders time their entries and exits by offering useful insights into trend strength and potential reversals.
What are the key components of the Aroon Indicator?
The Aroon indicator consists of two key components.
1. The Aroon Up line counts the number of intervals since the time period’s peak. It shows how long it has been since the previous high and how strong the uptrend is. A stronger uptrend is indicated by values of the Aroon Up line that are closer to 100 than by values that are farther from 100.


A high value of Aroon-Up indicates that the current price is close to the highest price observed within the defined period, suggesting a strong upward trend.
2. Aroon Down line: The Aroon Down line counts the number of intervals since the time period’s lowest low. It shows how long the decline has been since the previous bottom and how strong it is. The Aroon Down line, like the Aroon Up line, varies from 0 to 100, with values nearer 100 suggesting a steeper downturn.
A high value of Aroon-Down indicates that the current price is close to the lowest price observed within the defined period, suggesting a strong downward trend.
Aroon-Up and Aroon-Down swing between 0 and 100. The strength of the upward trend is determined by how near the Aroon-Up line is to 100. The closer the Aroon-Down line is near 100, the greater the downward trend. These two lines crossing or their relative locations offer important clues about the strength of a trend and probable trend reversals.
What is the formula and how to calculate Aroon Indicator?
The Aroon Indicator is calculated by calculating its two components: Aroon-up and Aroon-down.
Here are step-by-step processes to calculate the Aroon Indicator.
The Aroon-Up line counts the number of cycles since a given period’s maximum high.
Step 1: Find the highest high throughout the relevant period as the first step.
Step 2: Determine how many cycles have passed since the peak.
Step 3: To get the percentage, divide the Step 2 result by the number of periods and multiply by 100.
The formula for Aroon-Up is:
Aroon-Up = ((Number of periods – Number of periods since highest high) / Number of periods) * 100
The Aroon-Down line counts the number of cycles since a given period’s lowest low.
Step 1: Find the lowest low throughout the relevant period as the first step.
Step 2: Determine how many cycles have passed since the lowest low.
Step 3: To get the percentage, divide the Step 2 result by the number of periods and multiply by 100.
The formula for Aroon-Down is:
Aroon-Down = ((Number of periods – Number of periods since lowest low) / Number of periods) * 100
Aroon-Up and Aroon-Down values, their corresponding locations, and probable crossings should all be considered when interpreting the Aroon indicator.
Traders learn more about trend strength, potential reversals, and how to make better trading decisions by calculating the Aroon indicator using these methods.
What time period is typically used when calculating the Aroon indicator?
The Aroon indicator’s calculation time period is flexible and changes depending on personal preferences and trading tactics. 25 periods is the standard time frame that is frequently employed for Aroon computations.
Technical analysis typically uses the 25-period Aroon indicator as a baseline. It can identify patterns over a respectable period of time and provides a medium-term view of price changes.
How to use Aroon Indicator in Trading?
The Aroon indicator aids in determining a trend’s strength. A strong upward trend is shown when the Aroon-Up line is near 100, while a strong downward trend is indicated by a larger value for the Aroon-Down line. A bullish trend is indicated by a greater Aroon-Up value paired with a lower Aroon-Down value, while the opposite situation implies a bearish trend.
The Aroon indicator can assist you in spotting future trend reversals. Watch for intersections where the Aroon-Up and Aroon-Down lines cross.
An upward trend change and possible long opportunity is indicated when the Aroon-Up line crosses above the Aroon-down line. On the other hand, if the Aroon-Down line crosses above the Aroon-Up line, it can signal a change in the trend toward the downside and a potential buying opportunity.
Generating Buy and Sell Signals: The Aroon indicator has the ability to produce buy and sell signals.
For instance, the Aroon-Up line produces a long signal if it crosses a specified level (70 or 80). On the other hand, it produces a sell signal if the Aroon-Down line passes over a certain level. These threshold values are changed in accordance with your trading strategy and the current state of the market.

Confirmation with Other Indicators: You can use the Aroon indicator in combination with other technical indicators to increase the accuracy of its indications. For instance, you can use the Aroon indicator in conjunction with moving averages, oscillators, or volume analysis to improve your trading selections and confirm signals.
Establishing Stop Loss and Take Profit Levels: The Aroon indicator can help with stop loss and take profit level setting. For instance, you can set your stop loss below a recent swing low or a particular percentage away from your entry point if you decide to make a long trade based on a bullish Aroon crossing. Similar to resistance levels, historical highs are used to determine a take profit level.
The chart uploaded above is Nifty50’s Daily chart with Aroon 25 Period indicator applied on it. Observations are:
- Price of the script kept falling when the Aroon Down line kept sustaining around 0 levels as highlighted by a black box on the indicator and Price of the script kept rising indicating a strong trend upside when the aroon up line kept sustaining around 100 level as highlighted by a black box on the indicator.
- The purple line on the chart is 50 SMA. Look how Aroon indicator and SMA provided a confirmatory signal for trades.
- The candlestick patterns are used as added confluence for solidifying a trade setup to ride a trend.
- The blue vertical line represents the intersection point of Aroon lines when they crossover each other. The bullish side is expected when Aroon Up line crosses Aroon down line from below and the bearish side is expected when Aroon Down line crosses Aroon up line from above.
When is the best time to trade using Aroon Indicator?
A crossover trading strategy, in which a trader buys anytime the Aroon Up line rises over the Aroon Down line, is one of the most effective ways to employ the Aroon Indicator. The Aroon Down line, on the other hand, rises above the Aroon Up line, on the other hand, they would sell. This method constantly puts a trader in the market because there are no exit indications other than when the line crosses them.
How accurate is Aroon Indicator?
The market circumstances, the timeframe being examined, and the particular trading method used can affect the accuracy of the Aroon indicator. No indicator or tool is accurate, thus, traders should think in terms of precision and not accuracy. The Aroon indicator can deliver precise signs of continuing trends and probable trend reversals in trending markets, where it is built to perform best. In volatile or range-bound markets, it generates enough false signals.
Is Aroon Indicator profitable?
Yes, the Aroon indicator is profitable. The Aroon indicator is a useful tool for spotting trends, trend reversals, and evaluating the strength of trends. It can assist traders in making more educated trading selections and enhance their timing.
Can Fibonacci Retracement work well together with Aroon Indicator?
Yes, Fibonacci retracement levels can work well in conjunction with the Aroon indicator. Fibonacci retracement is a technical analysis method that employs horizontal lines based on Fibonacci ratios to pinpoint probable support and resistance levels in a market. It can improve the precision of locating entry and exit points when used in conjunction with the Aroon indicator.
Fibonacci retracement levels and the Aroon indicator both assist in identifying trends and trend reversals, as well as important price levels where a trend stops or reverses. In the chart uploaded below, one can observe how fibonacci worked as a solid confirmatory tool alongside aroon indicator. Aroon shows a bullish crossover, price of the script managed to sustain and close above the fibonacci ratio to signal potential upside. This is how an example of both in conjunction is shown.

How does Aroon Indicator differ from Moving Averages?
Moving averages and the Aroon indicator are both well-known technical analysis tools, but there are significant variations between them in terms of how they are calculated and the information they offer.
Moving averages are trend-following indicators that provide a visual depiction of the average price by smoothing out price data over a given time frame. They aid traders in determining a trend’s strength and direction, as well as probable levels of support and resistance. Simple moving averages (SMA) and exponential moving averages (EMA), among others, can be used to compute moving averages based on closing prices.
The Aroon indicator, on the other hand, is intended to pinpoint the timing and strength of trend shifts. The Aroon-Up line and Aroon-Down line, which count the intervals since the highest high and lowest low, respectively, are its two main lines. The Aroon indicator fluctuates between zero and one hundred, with readings close to one hundred suggesting strong movements and readings close to zero indicating weak trends or consolidation. The Aroon indicator aids traders in determining the strength of the current trend as well as probable trend reversals.
Moving averages concentrate on identifying trends and smoothing price data, but the Aroon indicator emphasizes determining when trends shift and how strong they are.
What are the advantages of the Aroon Indicator in Trading?
The Aroon Indicator has a number of advantages that help traders make better decisions. Here are 5 advantages.
- Identification of Trends: It aids traders in figuring out if a market is undergoing an upswing, decline, or a time of consolidation.
- Early Trend Reversal Signals: The Aroon Indicator can give early warning signs of probable trend reversals. Trading professionals can spot changes in market sentiment and receive notifications of potential trend changes by keeping an eye on crossings between the Aroon-Up and Aroon-Down lines.
- Quantifying Trend Strength: Trend strength is measured using the Aroon Indicator’s Aroon Oscillator, which computes the difference between the Aroon-Up and Aroon-Down values. With the use of this oscillator, traders determine if a trend is gaining or losing momentum by getting a numerical representation of the trend strength.
- Simple and Clear Visualization: Visualisation is easy and unambiguous because the Aroon Indicator is just two lines that alternate between 0 and 100. Because of its simplicity, the indicator’s indications are simple for traders to analyze and comprehend.
The Aroon Indicator could be used successfully in conjunction with other technical indicators and analytical methods. Trading signals get strengthened by combining them with tools like moving averages, oscillators, different time frame analysis, candlestick patterns, price action, or support and resistance levels, which provide traders with a more complete picture of the market. This compatibility makes the ability to customize analyses and increase the precision of trading techniques possible.
What are the disadvantages of Aroon Indicator in Trading?
The Aroon Indicator offers advantages, but there are several restrictions and potential drawbacks that traders need to be aware of.
- Lagging Indicator: The Aroon Indicator is a lagging indicator which means it uses historical price data to provide indications. As a result, it might not give accurate signals at a trend’s specific turning points.
- Choppy or Range-bound Markets: The Aroon Indicator is less accurate in choppy or range-bound market situations and works best in trending markets. The Aroon Indicator may provide erroneous signals or remain close to the centre range during such market stages, making it difficult to predict the market direction precisely.
- Limited Price Information: In order to determine its values, the Aroon Indicator only takes into account the highest high and lowest low within a certain time. Other price levels or elements, such as opening or closing prices, volume, or pricing trends, are not considered.
- Absence of environment: The Aroon Indicator offers insights into the strength of the present trend and possible reversals but does not offer comprehensive information about the larger market environment or fundamental issues.
The Aroon Indicator, like many other technical indicators, is prone to producing misleading signals during times of volatility or unexpected price increases. To minimize the misleading signals, traders can use other indicators and tools in conjunction to Aroon to trade high probability setups.
What is an example of Aroon Indicator used in Trading?

The chart uploaded above is an example of how Aroon indicator can work in action.
The price steadily rose and followed a proper trend towards upside. The Aroon Up line crosses over the Aroon down line giving a signal of upside.
Confluences are gathered from multiple indicators and tools, in this example, fibonacci is used. The retracement around 23.6% worked as a solid point from where the uptrend shall continue as Aroon in advance suggested a signal for upside.
The candlestick pattern is also observed strengthening the trading plan for upside.
This is how multiple confirmations are taken to decide a view and postulate a trading plan to find entries and exits and understand risk management accordingly.
What are some common misconceptions about the Aroon Indicator?
The Aroon Indicator has a few common fallacies that traders need to be aware of. The following are 5 common misconceptions about the Aroon Indicator:
- Aroon Indicator predicts price levels: One common misperception about the Aroon Indicator is that it forecasts certain price levels or offers exact entry and exit points. But rather than forecasting price levels, the Aroon Indicator mainly focuses on spotting patterns and trend reversals
- Aroon Indicator is effective in all market conditions: It works well in trending markets with distinct and persistent patterns. The Aroon Indicator, however, provides erroneous signals or unstable readings in volatile or range-bound markets
. - Aroon Indicator is a standalone trading system: While the Aroon Indicator offers insightful trend information, it is best to use it in conjunction with other indicators, chart patterns, and risk management techniques for a more thorough trading strategy.
- Aroon Indicator guarantees accurate predictions: It’s crucial to keep in mind that no indicator can provide faultless forecasts or flawless trading selections, including the Aroon indication.
- Aroon Indicator works on all timeframes: The Aroon indicator generates enough false signals on lower time frames thus they should be used on higher time frames like Daily.
Understanding these misconceptions enables traders to make better use of the Aroon Indicator and steer clear of using it as a stand-alone solution. Traders may use the Aroon Indicator in a well-rounded trading strategy by taking into account its advantages and disadvantages.
Is Aroon a leading indicator?
No, it is not believed that the Aroon indicator is a leading indicator. It is regarded as a lagging indicator since it calculates its values using prior price data. The Aroon indicator counts the number of seconds since the lowest low and highest high in a specified timeframe. As a result, rather than forecasting future price changes, it gives information regarding trends and trend reversals that have already happened.
Can the Aroon Indicator be used to identify potential trend changes in the market?
Yes, it is possible to spot potential trends in market trends using the Aroon Indicator. It is especially made to spot changes in market mood and give out early warning signs of trend reversals. The Aroon-Up and Aroon-Down lines’ crossings and divergences might give traders information into prospective changes in the current trend.
It indicates a probable change from a downtrend to an uptrend when the Aroon-Up line crosses over the Aroon-Down line. In contrast, when the Aroon-Down line crosses over the Aroon-Up line, it suggests a potential change in trend from up to down. Depending on the preferred trading technique, these crossovers can be used as indications to initiate or terminate transactions.


 Previous Article


 2026: Features, Pros vs Cons, Pricing, Reviews, Is It Worth It? 100")
 2026: Features, Pros vs Cons, Pricing, Reviews, Is It Worth It? 101")
 2026: Features, Pros vs Cons, Pricing, Reviews, Is It Worth It? 102")


 : Definition, Formula, calculation, Uses, Advantages Vs limitations 106")


No Comments Yet.