Volatility Indicators: Complete Guide, Types, Trading Strategy, Pitfalls


Volatility indicators are technical analysis tools that provide a gauge of market volatility and stability, enabling traders to make well-informed decisions regarding their buying or selling activities. Volatility indicators help traders gain a clearer understanding of the associated risks and potential market opportunities.
The common volatility indicators include bollinger bands, average true range (ATR), VIX, standard deviation, Keltner channels, and Donchian channels. These volatility indicators are used, apart from gauging volatility, to identify breakouts, set stop-loss levels, assess market conditions, and generate buy and sell signals.
Read on to learn more about volatility indicators, their types, strategies and common pitfalls to avoid.
What are Volatility Indicators?
Volatility indicators are used by traders to gauge the magnitude of price variations in financial products. Volatility indicators assist traders in making well-informed decisions regarding their purchasing or selling activities. They aid in risk management, strategy adjustments, and taking advantage of market fluctuations.
What are the Common Types of Volatility Indicators?
The common volatility indicators include bollinger bands, ATR, VIX, standard deviation, Keltner channels, and Donchian channels. Below are detailed explanations about each of the six.
1. Bollinger Bands
Bollinger Bands are a type of price envelope that was created by John Bollinger. The upper and lower price range levels are defined by pricing envelopes. Bollinger Bands are envelopes that are plotted at a standard deviation level above and below a straightforward moving average of the price. The bands are able to adapt to fluctuations in the fundamental price due to the fact that their distance is determined by the standard deviation.
The calculation of Bollinger bands involves the initial determination of a simple moving average. Next, compute the standard deviation over the same number of periods as the simple moving average. The standard deviation should be added to the moving average in the upper band. Subtract the standard deviation from the moving average in order to determine the lower band.
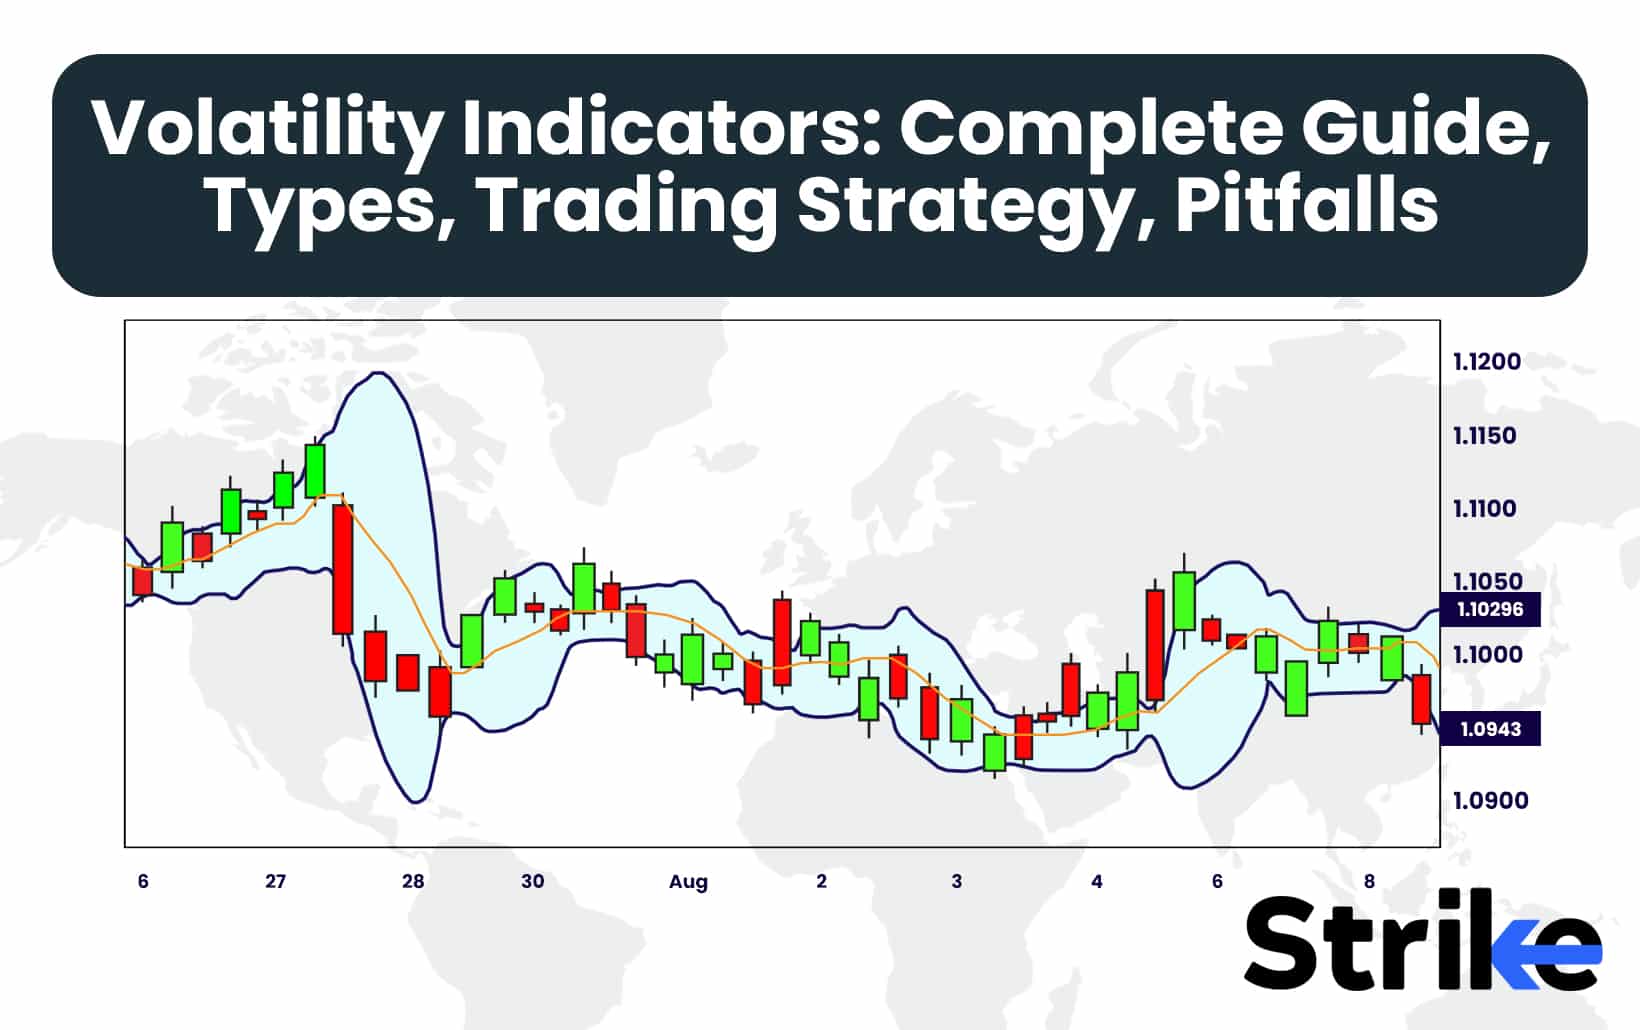
Below is what a Bollinger band looks like.

As seen in the image, Bollinger Bands are comprised of three lines – a middle 20-day simple moving average (SMA) flanked by upper and lower bands that are located two standard deviations apart. This is illustrated in the chart. The image illustrates significant Bollinger Band behaviors, including the band widening during periods of increased volatility, the band tightening during periods of calmer volatility, and the price hugging the upper band during powerful uptrends.
Traders employ these bands to assess market conditions, with prices that deviate from the bands potentially indicating trade opportunities or trend continuations. The BB(20,2) notation on the chart denotes the 20-day period and 2 standard deviation parameters.
2. Average True Range (ATR)
The average true range (ATR) is the sum of the true ranges for the specified period. Volatility is quantified by ATR, which accounts for any discrepancies in price fluctuations. The ATR calculation is typically based on 14 periods, which can be intraday, daily, weekly, or monthly.
The calculation of the average true return is relatively straightforward. The ATR fluctuates in response to fluctuations in price. ATR generates a new value immediately after the new time period has elapsed, utilizing historical price data. In order to determine the current average true range, it is necessary to compute the prior ATR and the current TR. The formula for the same is –
ATR = (Previous ATR * (n – 1) + TR) / n
Where,
ATR = Average True Range
n = number of periods or bars
TR = True Range
The True Range for today is the greatest of the following –
- Today’s high minus today’s low
- The absolute value of today’s high minus yesterday’s close
- The absolute value of today’s low minus yesterday’s close
Below is a graphical representation of ATR.


In the first image, we see an uptrend in price action. The ATR during an uptrend would consider the full range of each candle, including any gaps between trading sessions. As the trend progresses upward, the ATR might increase, reflecting greater volatility and larger price movements. This is particularly noticeable in the longer green candles that indicate strong buying pressure.
The second image depicts a downtrend. Here, the ATR would similarly measure the volatility, but in a declining market. The longer red candles, especially towards the end of the trend, suggest increased selling pressure and potentially higher ATR values. This increased volatility during a strong downtrend is common as fear and selling often accelerate price movements.
In both trends, the ATR would calculate the greatest of three measures for each candle: the current high minus the current low, the absolute value of the current high minus the previous close, or the absolute value of the current low minus the previous close. This comprehensive approach ensures that the ATR captures the full extent of price movement, even when there are gaps between trading periods.
3. Volatility Index (VIX)
The Chicago Board Options Exchange’s CBOE Volatility Index, also known as VIX, is a widely recognized indicator of the stock market’s anticipatory volatility, as determined by S&P 500 index options.
VIX is a real-time index that reflects the market’s anticipation of the relative intensity of near-term price fluctuations in the S&P 500 Index (SPX). It generates a 30-day forward projection of volatility and is derived from the prices of SPX index options with near-term expiration dates.
The VIX is determined by aggregating the weighted prices of out-of-the-money puts and calls in order to derive expected volatility. Utilizing options that expire in 16 and 44 days, respectively, Below are the steps to calculate VIX.
- Select put and call options on the S&P 500 index that expire in 30 days.
- Calculate the mid-point of the bid and ask price for each option. This is used to estimate the expected price of the option.
- Weight the prices based on the delta of each option. Delta represents the sensitivity of the option price to changes in the underlying S&P 500 index. Options further from the current S&P 500 price get lower weighting.
- Take a weighted average of the put and call option prices. This generates a single 30-day expected volatility figure.
- Annualize the 30-day VIX level by multiplying it by the square root of 12.
- Transform it into an index by multiplying the resulting annualized volatility by 100.
Below is the latest chart available for VIX.

4. Standard Deviation
The standard deviation is a statistical proxy for market volatility, indicating the extent to which prices deviate from the average price. Low volatility is indicated by a low standard deviation when prices trade within a confined trading range.
The standard deviation is the method by which volatility is typically calculated in finance, whether it is historical or realized. Historical volatility is calculated as the standard deviation of logarithmic returns using the most prevalent method.
There are two types of standard deviations – Population Standard Deviation and. Sample Standard Deviation.
The formula for Population Standard Deviation is 
And the formula for sample standard deviation is
5. Keltner Channels
The Keltner Channel is a technical analysis indicator that is comprised of three separate channels. It comprises a central moving average line and channel lines that are situated both above and below the central one. It is named after Chester W., an American trader.
The Keltner Channel is employed to evaluate fluctuations in price action. It is constructed to ensure that any movements that exceed or descend below the upper and lower bandsare exceedingly uncommon and necessitate closer examination.
Trends in the Keltner Channel frequently commence with significant movements in either direction, with surges that surpass the upper band, suggesting unusual strength, and the reverse, suggesting unusual weakness.
The EMA for Keltner channels is typically collected over a period of 20. The upper and lower bands expand and contract in accordance with the volatility, and the formulas for these bands are below.
Keltner Channel Middle Line = EMA
Keltner Channel Upper Band = EMA+2*ATR
Keltner Channel Lower Band = EMA-2*ATR
Where,
- EMA = Exponential Moving Average (typically over 20 periods)
- ATR = Average True Range (typically over 10 or 20 periods)
- 2 = Multiplier
Below is a graphical representation of Keltner channels.

In this chart, we will be able to observe how the price action interacts with the Keltner channels. The central line ( the green line) acts as a dynamic support and resistance level. The price trending upwards is signalled by the line staying above this central line, and when trending downwards, it often remains below it.
The upper and lower channel lines (the blue lines) serve as dynamic overbought and oversold indicators. It may suggest an overbought condition when the price touches or exceeds the upper channel, potentially signaling a pullback. Conversely, when the price approaches or breaches the lower channel, it might indicate an oversold condition, possibly foreshadowing a bounce.
We will be able to see periods where the price action respects these channel boundaries, bouncing off them or using them as support or resistance. There are also instances where the price breaks through the channels, which can signal strong trend continuation or potential reversal points.
The width of the channels expands and contracts with volatility. When volatility increases, the channels widen, and when it decreases, they narrow. This dynamic nature allows traders to adjust their strategies based on current market conditions.
6. Donchian Channels
Donchian Channels are a technical indicator that is designed to spot bullish and bearish extremes that are conducive to reversals, breakouts at higher and lower levels, breakdowns, and other emergent trends. , where N is typically equivalent to twenty. It can be found on the majority of trading platforms.
The indicator is predominantly applied by traders to identify potential breakouts and retracements. A breakout occurs when the price of a security rises above a resistance level (previous high) or falls below a support level (previous low). A security’s price begins to return to its previous level following a substantial change, which is referred to as a retracement. Look at the chart below.

The Donchian Channel employs three bands, with the upper band displaying the greatest price of the previous period and the lower band displaying the lowest price of the previous period. The average of the two costs is depicted in the middle line.
The three bands indicate the present market momentum in a stock or financial instrument, allowing traders to take a market position to profit from an anticipated increase or decrease in value, based on indicative signals.
The market may be in a favorable trend if it is trading toward the upper band, which suggests a long position on a financial instrument or the market as a whole. In the event that the market trend is moving toward the lower band, which indicates a bearish trend, the converse is also true; this is a signal to execute a short position.
Nevertheless, prices trading within the middle line suggest that the market is experiencing low volatility. In this case, a hold strategy may be implemented until additional signals are received.
Utilizing a combination of indicators such as Bollinger Bands, ATR, VIX, Standard Deviation, Keltner Channels, and Donchian Channels help market participants gain a more comprehensive understanding of market volatility, helping them make more informed decisions about entries, exits, and risk management in their trading and investment strategies.
How to Use Volatility Indicators in Trading
ATR, Bollinger Bands, Standard Deviation, and Donchian Channels are useful in identifying breakouts, setting stop-loss levels, assessing market conditions, and generating buy and sell signals. Read below to learn how.
Identifying Breakouts
Volatility indicators like ATR are helpful in identifying breakouts.
- ATR indicator displays low values during periods of price consolidation and low volatility in the market.
- Periods of price consolidation are always followed by breakouts, where prices start trending strongly in one direction.
- The breakout after consolidation leads to high volatility, as evidenced by a surge in the ATR indicator.
- Traders use the ATR to identify periods of low volatility consolidation and prepare for the impending volatile breakout.
- ATR surging after a period of low readings signals the breakout is occurring and volatility is expanding.
- Low ATR indicates future opportunity, while surge in ATR signals the time is now to trade the new directional move.

In the upper part of the chart, we see the price action represented by Heikin-Ashi candlesticks, which provide a clearer view of trends compared to traditional candlesticks. The red line represents a Simple Moving Average (SMA) with a period of 30. The lower part of the chart shows the ATR indicator.
Looking at the ATR, we observe periods of contraction and expansion. Periods of low ATR values indicate decreased volatility and often precede significant price movements or breakouts. Conversely, when the ATR begins to increase, it suggests rising volatility, which can signal the start of a new trend or a potential breakout.
In this chart, we see that the ATR reached relatively low levels around January 2019. This period of low volatility coincided with the price consolidating and moving sideways. As the ATR began to increase slightly, we saw the price start a strong upward trend, breaking out from its previous range.
Setting Stop-Loss Levels
Bollinger bands are used to set stop-loss levels. Let us see how.
- The lower band can act as a trailing stop-loss level. As the price moves in the direction of the trend, the bands widen and the lower band moves up, raising the stop-loss with the uptrend.
- In an uptrend, prices generally move up near the upper Bollinger Band as momentum increases.
- As the uptrend starts losing steam, price will pull back from the upper band toward the middle band, which is a moving average.
- The price in an uptrend deviates away from the moving average. As momentum slows, it gravitates back toward the average.
- Trend traders can place a stop-loss order below the middle band and trail the stop upward along with the middle band as the trend progresses.
- More conservative traders could place the stop-loss below the lower Bollinger Band, further away from the current price action.

In this chart, we will be able to observe how price action interacts with the Bollinger Bands over time. During trending periods, the price tends to stay within the bands, often using the middle band as a dynamic support or resistance level. However, breakouts occur when the price moves decisively outside of these bands.
The chart demonstrates a trailing stop strategy using the middle band. Traders could set their stop loss at the middle band and adjust it as the band moves. This approach allows them to capture profits while still giving the trade room to breathe. The trade would exit if the price falls below the middle band, indicating a potential trend reversal.
Assessing Market Conditions
Standard deviation help reveal insights about current market conditions when applied to price or indicators.
- Higher standard deviation means wider price swings and greater volatility. Lower standard deviation indicates more consolidation.
- Standard deviation can be calculated for any indicator like volume or RSI too.
- If indicator standard deviation rises, it signals momentum and expanding volatility.
- Compare current standard deviation vs past values to see if volatility is high or low relative to norms for that market.
- Spikes in standard deviation indicate periods of outsized volatility. Steady low values mean low volatility consolidation.
Traders mainly want to identify when volatility expands from a low level indicating a new trend. Comparing current vs past standard deviation helps determine this.
Generating Buy and Sell Signals
Donchian channels are known as 2-in-1 volatility indicators that help generate buy and sell signals.
- Prices hitting the lower band signal a buy
- Prices reaching the upper band indicates a sell opportunity
Look at the chart below.

Here, we will be able to see several where the Donchian Channels provide clear buy and sell signals. Buy signals are typically generated when the price breaks above the upper channel, indicating a potential uptrend or continuation of an existing uptrend. The green circles on the chart highlight these buy signals, where the price decisively moves above the upper Donchian Channel.
Sell signals are identified when the price breaks below the lower channel, suggesting a potential downtrend or continuation of an existing downtrend. The chart shows two sell signals, marked by blue circles, where the price drops below the lower Donchian Channel.
It’s crucial to remember that these tools are most effective when used in conjunction with other forms of analysis and within the context of a well-defined trading plan tailored to individual risk tolerance and market understanding.
Combining Volatility Indicators with Other Indicators
Integrating volatility indicators with other technical tools can provide traders with a more comprehensive view of market dynamics, enhancing their decision-making process
- Using Keltner channels alongside momentum indicators helps confirm trends and filter out potential false signals, especially in range-bound or highly volatile markets.
- Combining volatility-based indicators like Keltner Channels with momentum tools allows for more dynamic stop-loss placement, adapting to changing market conditions.
- The systematic approach of using multiple indicators helps traders overcome emotional biases, promoting more rational decision-making based on quantifiable market data.
- The integration of volatility and momentum indicators improves the ability to identify and confirm genuine breakouts, distinguishing them from false moves.
Combining volatility indicators with other technical tools help traders develop more robust strategies that account for various market aspects, leading to potentially more informed and effective trading decisions.
Volatility-Based Trading Systems
Volatility-based trading systems leverage market fluctuations to identify potential profit opportunities. Here are five key aspects of these systems.
- Utilize indicators like Average True Range (ATR) to measure price volatility
- Implement breakout strategies based on volatility spikes
- Incorporate volatility filters to confirm trend strength and potential reversals
- Use quantitative algorithms for high-frequency volatility trading
- Adapt position sizing and risk management based on current market volatility levels
These volatility-based approaches enhance trading strategies, but always remember to practice proper risk management when implementing them.
How to Avoid Common Pitfalls of Volatility Indicators?
To avoid common pitfalls when using volatility indicators, it’s important to take a comprehensive approach to trading. Rather than relying solely on volatility indicators, use them as part of a broader trading strategy that incorporates other technical analysis tools. Confirm signals from volatility indicators with other indicators, price patterns, and support/resistance levels.
Remember that volatility indicators cannot predict the stock market direction with certainty, so avoid making trading decisions based solely on these indicators. Instead, use them to gain insights into stock market conditions and adjust your risk management strategies accordingly.
It’s crucial to understand that no single indicator is foolproof, so always consider multiple factors when making trading decisions. Taking a holistic approach and using volatility indicators in conjunction with other analysis methods help better navigate the complexities of the market and make more informed trading decisions.
What is the Best Indicator for Volatility?
The best indicator for volatility are Bollinger Bands, ATR (Average True Range) Indicator, VIX (Volatility Index), Keltner Channel Indicator, and Donchian Channel Indicator. Each of these indicators offers unique insights into market volatility.
Bollinger Bands expand and contract based on market volatility, making them excellent for identifying potential breakouts and mean reversion opportunities.
ATR measures market volatility by calculating the average range between high and low prices over a specified period. It’s particularly useful for setting stop-loss levels and determining position sizes.
The VIX measures the market’s expectation of 30-day volatility in the S&P 500. It’s widely used to gauge overall market sentiment and potential turning points.
Keltner Channels use a central moving average with upper and lower bands based on the Average True Range. They can help identify trends and potential reversals.
Donchian Channel Indicator plots the highest high and lowest low over a specified period, creating a channel that expands and contracts with volatility. It’s often used in trend-following strategies and breakout trading.


Share


No Comments Yet