Triangle pattern gets formed when the price gets formed within two converging trend lines with an identical slope. Triangle pattern is referred to as a trend continuation pattern because traders expect that the price will continue in its prevailing trend after breaking out from the range.
Triangle pattern is important to know because it is generally formed before the price gives an exploding move either towards upside or downside. Traders expect the market to accelerate in the direction of the prevailing trend as the range of this pattern gets narrower.
Triangle pattern also helps traders in trading with a good risk to reward ratio. The target price of the triangle pattern is usually equal to the total range of the pattern. Traders project the total range of the pattern from the point of breakout and set up their target. And stop loss is kept below the support line of the triangle pattern.
Here are some of the advantages of triangle pattern are –
- Easy to spot on the price chart
- Provides a good risk to reward ratio to traders
- This pattern is effective across all timeframes and all types of markets.
The triangle pattern is an effective pattern in technical analysis. One should always remember to use this pattern with additional technical tools to improve its probability. This pattern can surely help you to enhance your edge in the markets and make good trading decisions.
What does a Triangle Chart Pattern in Technical Analysis mean?
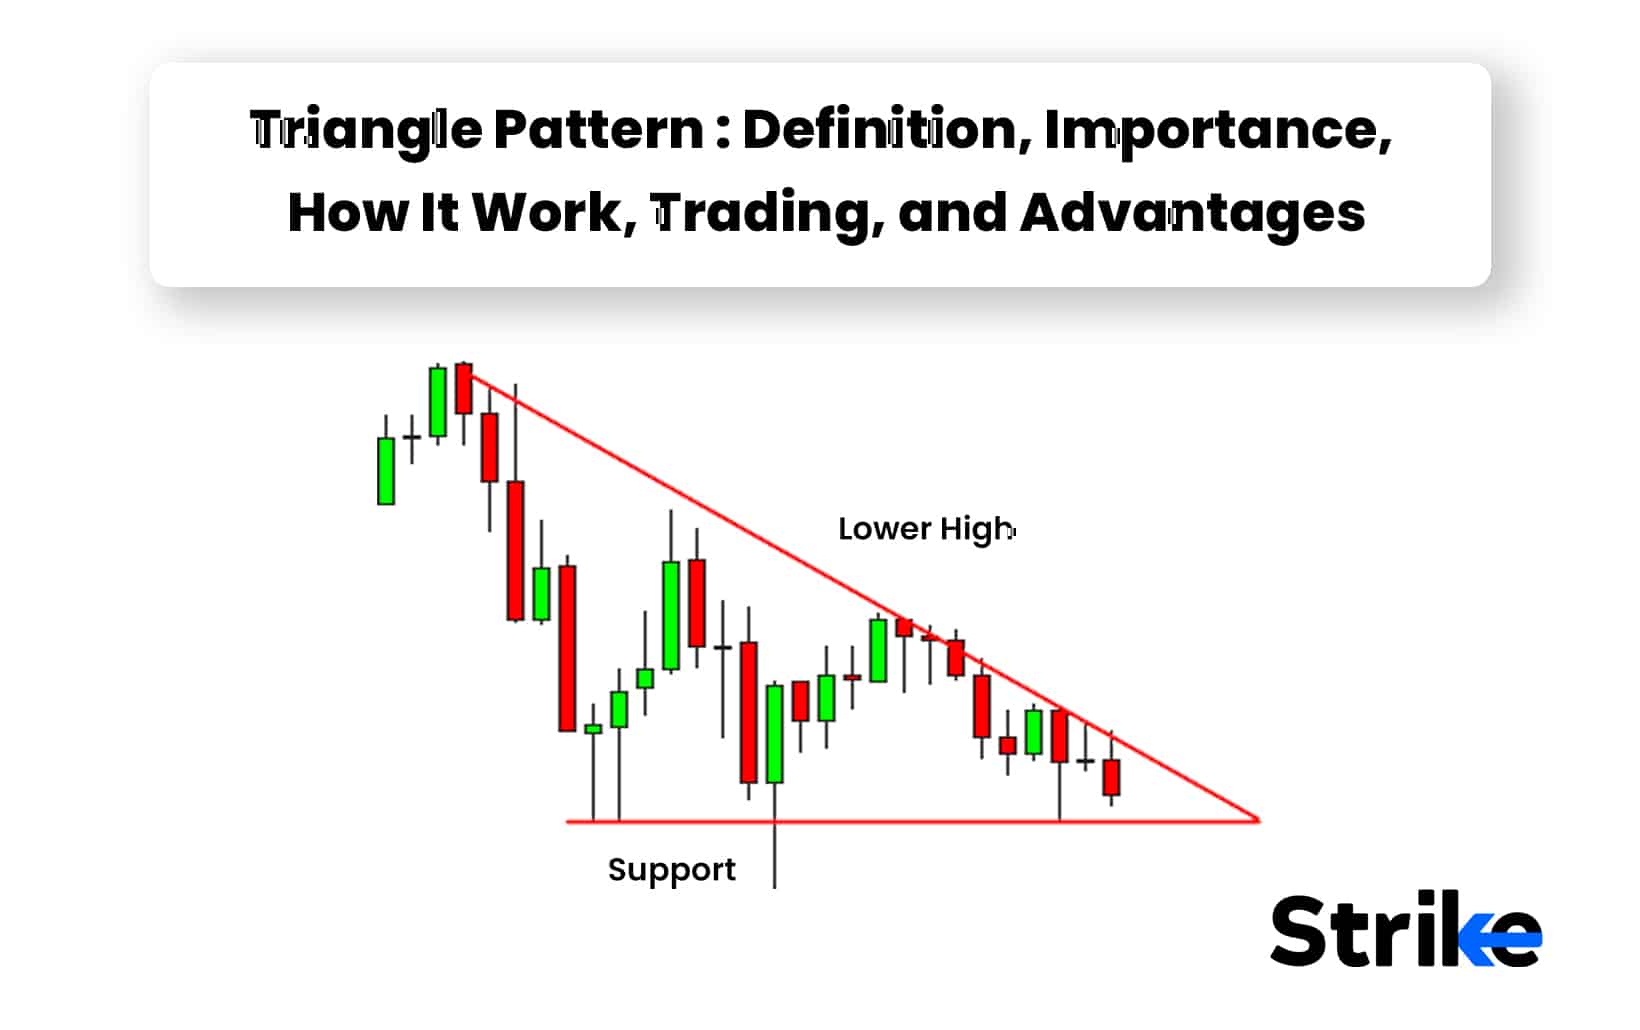
A triangle pattern in technical analysis forms when 2 converging trend lines connect with the highs and lows of the price as the range narrows down. Triangle chart pattern in technical analysis indicates the formation of a sideways market. A market where the buyers and sellers are in balance. Triangle pattern unfolds when the price breaks out from the range and continues in the direction of the prevailing trend.
The price is likely to continue in the direction of the prevailing trend once the pattern is breached. Traders consider this as a potential breakout failure of the pattern when the price fails to continue upwards, and the market trend reversal is a real possibility from this point.
One should always remember that technical analysis is just the study of charts and graphs by analyzing price data of the past for predicting future price movements. It need not be accurate 100% of the time. A trader must always analyze his potential risk and trade carefully.
What is the importance of a Triangle Pattern in Technical Analysis?
A triangle pattern is important in technical analysis as it provides traders with good trading opportunities. A triangle pattern forms when the market is consolidating and slowly narrowing in a range. This pattern is called a “triangle” because the upper downward sloping resistance line and the upward sloping support line together make up the shape of a triangle.

Another important role of a triangle pattern in technical analysis is that it helps a trader in analyzing and reading the charts more effectively. Following are 3 additional reasons that shows the importance of a triangle pattern in technical analysis –
- High probability setup –
The consolidation which leads to the breakout of the triangle pattern makes it more effective. The triangle pattern also provides traders with a good risk to reward ratio and when combined with other technical tools, this pattern gets very effective.
- Clear entry and exit –
The triangle pattern provides a clear point for taking an entry and an exit. It offers exact defined rules for traders to follow and set up their target price and stop loss limit order. For example, traders enter when the price goes above the high of the breakout candle and put their stop loss below the support line of the triangle pattern while taking a bullish trade.
- Works on every time frame –
The triangle chart pattern forms on every timeframe of a price chart. It is very effective across all sorts of markets when it is used with a combination of additional technical tools..
The triangle chart pattern is important in technical analysis as it provides valuable insights to the traders. These insights further help traders in managing their trades effectively.
How does a Triangle Chart work?
The triangle pattern also works by helping traders in determining the future price action which further helps them in taking effective trading decisions. It is formed with the help of two converging trendlines. The first is a downward sloping resistance line and the second one is an upwards sloping support line. These two lines together form a triangle pattern.
Triangle pattern is known for giving explosive moves in the direction of the prevailing trend after the breakout. It indicates a potential continuation as well as a potential reversal in the market. This is why, triangle chart pattern is also called the Bilateral pattern.
How does a Triangle Chart Pattern form?
A triangle chart pattern forms when there is a balance between the buyers and sellers. A triangle chart pattern also forms when the price is narrowing down in a range. This pattern is made in a triangular shape. You can see this by plotting two trend lines, one touching the highs of the range and one touching the lows of the range.
The beginning of this pattern usually starts with a rally. It is only when the market is stable and wants to further continue in its prevailing trend, that this pattern is formed. The price makes a sideways structure when trading between two trendlines. Triangle pattern is a trend continuation pattern but it can break out from both sides. The price usually moves in continuation of the prevailing trend after breaking out from the pattern. It is a breakout failure of the triangle pattern when the price fails to continue, and the trend is most likely to reverse from this point.
The chances of a breakout are at the highest level when the price reaches the apex point of the structure. This is the point where both the trendlines meet. Following are 3 of the most followed rules when it comes to trading a triangle chart pattern –
- The price should touch the support trendline at least 2 times
- The price should touch the resistance trendline 2 times
- There must be an upsurge in the volume when the price breaks out or breaks down. Low volume during a breakout/breakdown is an indication of the potential move being fake.
Following all the given rules of the triangle pattern will enhance your setup’s probability. Always trade with the triangle pattern in conjunction with other technical tools to find better edges and to confirm the pattern with multiple factors.
What happens After Triangle Pattern?
Two scenarios are to happen after the formation of the triangle chart pattern. Here are both the scenarios likely to happen after a triangle pattern –
Scenario number 1: This is the most likely scenario which will unfold as the triangle pattern is a trend continuation chart pattern. The price will most likely break out and continue in the direction of the prevailing trend. The buyers will take long positions and set their target similar to the total range of the triangle pattern and forecast that range from the point of breakout while setting their stop losses below the low of the support line of the triangle chart pattern.
Scenario number 2: Markets are random. No strategy is successful at all times. The breakout will fail if the triangle pattern fails, and the price will start continuing in the opposite direction of the prevailing trend sharply or the price can also break down from the lower side of the pattern. Sellers are active in this situation and they will most likely keep shorting the market as the market is looking weak.
Triangle chart pattern is also called a bilateral pattern because the price can break from both sides of this pattern. This is why there are 2 scenarios likely to happen after the formation of a triangle pattern.
What is the success rate of a Triangle Pattern in Technical Analysis?
The success rate of a triangle pattern in technical analysis is subjective. The success rate of a triangle pattern or any other chart pattern depends on many factors such as the trader’s ability to execute the trade, market condition, market liquidity, current sentiment in the market, etc.
Different traders will trade triangle patterns in different manners. For example, one trader will solely rely on volume and triangle pattern for executing the trade while another trader use RSI (Relative Strength Index) alongside triangle pattern. This will create different outcomes for both the traders over a series of trades.
Hence, it is therefore tough to measure the exact success rate of a triangle pattern in technical analysis.
How Accurate is the Ascending Triangle Pattern?
The accuracy of an ascending triangle pattern is difficult to measure. The accuracy of an ascending triangle pattern or any other chart pattern depends on market factors like a trader’s ability to execute the trade, set profits and losses, liquidity of the stock, market sentiment, etc.
The tools used alongside an ascending triangle pattern can also affect the overall accuracy of the pattern. This means that the accuracy of this pattern will change when this pattern is used with different indicators and in different market situations.
This is why it is tough to calculate the exact accuracy of an ascending triangle pattern.
What are the different Types of Triangle Chart Patterns?
There are 3 types of triangle chart patterns. All these types of triangle chart patterns must follow the same set of rules that are – The price must touch both the trendlines at least 2 times and the breakout/breakdown must come with rise in volumes. Here are the 3 types of triangle chart patterns –
- Descending Triangle –
A descending triangle pattern is a bearish continuation pattern which forms with a horizontal support line that connects with the identical lows and a downward sloping resistance line. A descending triangle works completely opposite to an ascending triangle pattern. Traders consider this pattern to give a breakdown after it has touched both the trendlines for a minimum of 2 times.
The horizontal support line acts as a support once the price breaks down on the lower side. The horizontal support line will become resistance once the price breaks down on the lower side of the pattern. Traders will short the market at the point of the breakdown and set up their targets by measuring the range of the descending triangle pattern from top to bottom and forecasting it downwards from the point of breakdown. The stop loss will be slightly above the resistance line.

The descending triangle pattern forms after a bearish rally, unlike the other 2 triangle patterns.
Let us look at an example of a descending triangle pattern on a price chart.
Notice how the descending chart pattern is formed after a bearish rally. The price has also touched both the trendline for a minimum of 2 times. This is an ideal example of the descending bearish triangle pattern.
- Ascending Triangle Pattern –
An ascending triangle pattern looks the complete opposite of a descending triangle pattern. An ascending triangle pattern is a bullish continuation pattern which forms when a horizontal trendline acts as a resistance while an upward sloping trendline acts as the support.
Traders expect the price to break out through the upper side of the pattern. Traders buy at the point of breakout and set the target by measuring the total distance from the top of an ascending triangle pattern to the bottom and forecasting it upwards from the point of the breakout. The stop losses are set slightly below the support line of the pattern. An ascending triangle pattern forms after a bullish rally and it is called a bullish continuation pattern.

Here is an example of the ascending triangle pattern on a price chart –
Notice how the ascending triangle pattern forms after a bullish rally. The price touches both the trend lines for a minimum of 2 times to validate this pattern. This is an ideal example of an ascending triangle pattern.
- Symmetrical Triangle –
A symmetrical triangle is different from the other two types of triangle pattern. A symmetrical pattern forms when the price is narrowing under a downward sloping resistance line and an upward sloping support line.
A symmetrical triangle breaks out from both of its sides. This means that a symmetrical triangle pattern is a neutral pattern. Traders use symmetrical triangle for trading in both the sides. Here is an example of the symmetrical triangle pattern on a price chart –

Notice how the pattern formed after a bullish rally but broke down on the lower side. Also notice how the price has touched both the trendlines for a minimum of 2 times.
How to calculate the potential price target for a Triangle pattern?
The calculation of the potential price target of a triangle pattern is done through a common method used by many traders. The potential target of a triangle pattern is calculated by measuring the distance of the triangle from top to bottom and forecasting the same distance from the breakout point of the triangle pattern.

Look at the image above and notice how the total range of the triangle pattern from top to bottom is projected upwards from the point of the breakout. This method is a traditional method used for deciding price targets in a triangle pattern. You can also find this method mentioned in lots of books. You can reverse the process and use it on a bearish triangle pattern as well.
Traders use the height of the pattern to project the potential price target because the consolidation within the pattern represents the magnitude of the price movement. The assumption behind this is that the price moves in similar fashion after the breakout as it did within the pattern itself.
What is the Target Price in Triangle pattern?
Traders expect that the price will at least move breakout and travel the same distance as the range of the triangle pattern. This is the traditional method of setting up targets while using a triangle pattern and has been described by lots of experienced and famous traders.
What is the Triangle Pattern Target?
The triangle pattern’s potential target is calculated by measuring the total distance of a triangle pattern from top to bottom and forecasting that same distance from the point of breakout of the pattern. This is the most reliable and used method of calculating the potential target of the triangle pattern.
How to Trade using Triangle Chart Pattern in Stock market?
Taking a trade using a triangle chart pattern is easy compared to other chart patterns. Trading using a triangle chart pattern will enhance your probability to become profitable as it is a very effective pattern. Here’s how you can trade using a triangle chart pattern in 3 easy steps.
- Spot the triangle pattern –
The first step is to identify the triangle pattern. You must be able to spot the triangle pattern correctly. Always remember the rules for identifying this pattern without mistake.
- Check whether the breakout is fake or not –
The price is most likely to give a breakout from any side of the pattern as the price narrows down. One key thing to remember while confirming the validity of this pattern is to always check for volumes at the time of a breakout. it is most likely that the breakout is not fake if the volume rises at the time of the breakout and you can then take the trade.
- Execute the trade –
Execute the trade with the direction of the breakout. Enter when the breakout candle’s high is violated. Set your target by measuring the total distance of the triangle pattern from bottom to top and forecast the same distance from the point of breakout. Set your stop loss slightly below the low of the support line of the triangle pattern. Many traders argue that the triangle pattern works best when the markets are trending, but there is no such thing as the perfect or best time to execute a trade using this setup. The best time to buy and sell using a triangle pattern is subjective.
You can create your own setup using a triangle pattern and can back test on the price chart to come up with an effective strategy. You can then use additional technical tools with this setup to come up with the best time to buy or sell using a triangle chart pattern according to your own setup.
What is the best Trading Strategy for Triangle Chart Pattern?
One of the best yet simplest triangle pattern strategies is when it is used with the volume indicator. The rest of the process is the same as it is when trading using the triangle pattern. The only thing you have to check is, at the time of the breakout, the volume of the candle which breaks out from the pattern must be higher than of the previous 2 candles. It is observed that when the volume of the breakout candle is higher than of the previous 2 candles, the probability of the price continuing in its prevailing direction is very high.
What Technical Indicator is best to use with Triangle Pattern?
Volume is the most crucial indicator when it comes to the triangle pattern because it is very important to confirm the validity of the breakout. Rising volume at the time of the breakout is the most effective indication of an original breakout and can help traders save money by not entering into fake breakouts. Notice how the volume is rising at the time of the breakout. The probability of your setup will increase dramatically once you start taking trades only when the volume is supporting the breakout.
What are examples of Triangle Chart Patterns used in Trading?
Examples of the triangle chart patterns are seen much frequently while trading. Here are 2 of the examples of triangle chart patterns used on the price chart –
- Ascending triangle pattern –
An ascending triangle pattern forms when the price is in a range. You can identify it by drawing a horizontal resistance line which touches all the highs of the price range and an ascending support line which touches all of the price range. An ascending triangle indicates a period of sideways momentum before the price continues in the direction of its prevailing trend.
As the above image shows, the price is stuck in a range as the market is halting. The support line slopes slightly upwards as this range narrows down, while the resistance remains the same. This higher low structure indicates strong buying pressure.
A trader can take a long position at the point of the breakout and set up a target by measuring the total range of the triangle pattern and forecasting the same range from the high of the breakout candle.The stop loss can be set up slightly below the support line of the pattern.
- Descending triangle pattern –
A descending triangle pattern is a bearish continuation pattern. It indicates traders to take a short position. It forms as the price narrows down within a downward sloping resistance line and a horizontal support line.
The price is in a downtrend and taking a halt while creating a range as is shown in the above image. The support of this pattern is almost the same while the resistance is sloping downwards slightly. This lower high structure shows the dominance of the sellers.
A trader can take short positions at the point of the breakdown as the pattern breaks down. He/She can set up a target by measuring the total range of the triangle pattern and projecting it from the point of breakdown. The stop loss is set up slightly above the resistance line of the pattern.
How Can You Use Previous Price Data to Backtest and Develop Your Triangle Pattern Trading Strategies?
You can use previous price data to backtest and develop your triangle pattern trading strategies. The previous price data of any stock, commodity and currency is easily available on any charting platform.
Just open any price chart and look for the triangle pattern formation. Confirm the pattern with the additional technical tools like volume. This way, you can easily backtest the triangle pattern by using previous price data.
You can also try adding new technical indicators with this setup. This will help you in identifying the triangle pattern’s effectiveness with different technical indicators. You can develop your own triangle pattern trading strategies by following the methods mentioned above.
How does the Triangle Pattern differ from other Types of Chart Patterns?
A triangle pattern differs from other types of chart patterns on 2 major bases. Here are 2 of the main differences between a triangle pattern and any other type of chart pattern.
- Triangle pattern is a sideways pattern –
A triangle pattern forms when the price is taking a break from all the action. A triangle pattern is formed when the buyers and sellers are in balance and the future trend is still unclear.
- Triangle pattern can breakout from both the sides –
Triangle pattern does not have any directional bias like the head and shoulders pattern. The triangle pattern does not give an early entry or an early indication of a breakout like other chart patterns. It can break out from any one side at the very last moment also.
A triangle pattern is a very effective and unique chart pattern. Triangle patterns easy to execute setup makes it an attractive setup for even a beginner to execute.
What Chart Pattern is similar to Triangle Pattern?
Wedge patterns and pennants are similar to triangle patterns. Wedge pattern and pennants are similar because wedges and triangle patterns are both consolidation patterns that suggest a continuation or a potential reversal in the current trend.
Pennants on the other hand, are also consolidation and continuation patterns just like a triangle pattern. All three of these chart patterns have a resistance and a support line which converges at an apex point.
What are the advantages of the Triangle Pattern?
The triangle pattern is widely used by traders worldwide due to its frequent occurrence and effectiveness. The triangle pattern also helps traders in finding good trading opportunities and predicting the future price movements. Following are 5 advantages of using the triangle pattern in the stock market.
- Easy to identify –
A triangle pattern is easy to spot on a price chart. You will be able to identify this pattern effectively over time by practicing on the price chart.
- Provides a great risk to reward ratio –
The default stop loss for the triangle pattern is small while the potential profit target is huge. This is why the triangle chart pattern provides a great risk to reward ratio.
- It is effective in all types of markets and on all time frames –
A trader can enhance the probability of his trades by using a triangle chart pattern. It works in all types of markets such as commodities and currencies. It is also effective on multiple time frames.
- Can be used with other indicators –
The accuracy of a triangle pattern are increased by using it with additional technical tools. Traders can use technical indicators like volume and RSI (Relative Strength Index) to increase the probability of their setup.
- Provides clear entry and exit –
A triangle pattern provides predefined entry and exits. This helps a trader in clearing up confusion and leads to effective trade management.
A triangle pattern is an easy to spot and effective chart pattern. Its listed advantages surely make this pattern look more lucrative when compared to other chart patterns.
What are the disadvantages of the Triangle Pattern?
The triangle chart pattern does have its disadvantages. Following are 5 disadvantages of using a triangle pattern in the stock market.
- False signals –
The triangle pattern can also generate false trading signals just like every other technical setup. This can misguide the trader in taking wrong trading decisions which can further lead him to incur losses.
- Less effective shorter time frames –
The triangle pattern is less effective in shorter time frames when compared with longer time frames. The triangle pattern breakouts on the shorter time frames are fake most of the time.
- Cannot be trusted solely –
A triangle chart pattern cannot be trusted solely. This pattern requires additional technical tools to enhance its probability. For example, the validity of a breakout from the triangle pattern cannot be confirmed properly without the volume indicator.
- Subjective drawing –
The trendlines a trader has to draw to identify a triangle pattern can be subjective. This can lead to spot faulty patterns on the price chart and incur losses.
- Small breakouts –
The breakouts from the triangle chart pattern are sometimes not that big. This means that traders are not able to earn big profits from this chart pattern.
This pattern is effective but one must also be aware of the triangle pattern’s limitations. You must always remember to manage your own risk effectively while using this pattern.
Is a triangle pattern bullish?
Yes, a triangle chart pattern is a bullish as well as a bearish chart pattern. A bullish triangle pattern forms in the continuation of a previous bullish leg of the stock. It forms when the price forms within two converging trend lines with an identical slope. This is why a triangle pattern is also called a trend continuation pattern. An example of a bullish triangle pattern is an ascending triangle pattern.


 Previous Article


 2026: Features, Pros vs Cons, Pricing, Reviews, Is It Worth It? 34")
 2026: Features, Pros vs Cons, Pricing, Reviews, Is It Worth It? 35")
 2026: Features, Pros vs Cons, Pricing, Reviews, Is It Worth It? 36")


 : Definition, Formula, calculation, Uses, Advantages Vs limitations 40")


No Comments Yet.