


The three outside up candlestick pattern is a variation of the chart candle reversal pattern that is used to indicate a trend reversal. The three outside up pattern forms at the downtrend and it takes three days for the pattern to form. The three outside up candlestick pattern comprises three consecutive candles forming the patterns most preferably at the end of the downtrend.
The first candle is red, a part of the prevailing downtrend. The next two are green candles that indicate a bullish reversal. Users need to have a basic understanding of how this pattern is formed to use the same. This article discusses the three outside up candlestick patterns in detail, its formation, trading, advantages, disadvantages, and more.
What is the Three Outside Up candlestick pattern?
The three outside up is a pattern that forms on the candlestick chart over three trading sessions. Three outside up comprises three candlesticks and forms typically in a downtrend or an uptrend an extended downward price swing. Here it can indicate a potential price reversal to the upside.

This triple candlestick pattern is an extension of the bullish reversal day pattern or the bullish engulfing pattern. This pattern is formed over three days of trading after a prolonged down string on the daily timeframe with the first two trading days looking like a bullish reversal or bullish engulfing day formation. The third candlestick completing the pattern is a bullish candlestick that approves the potential reversal.
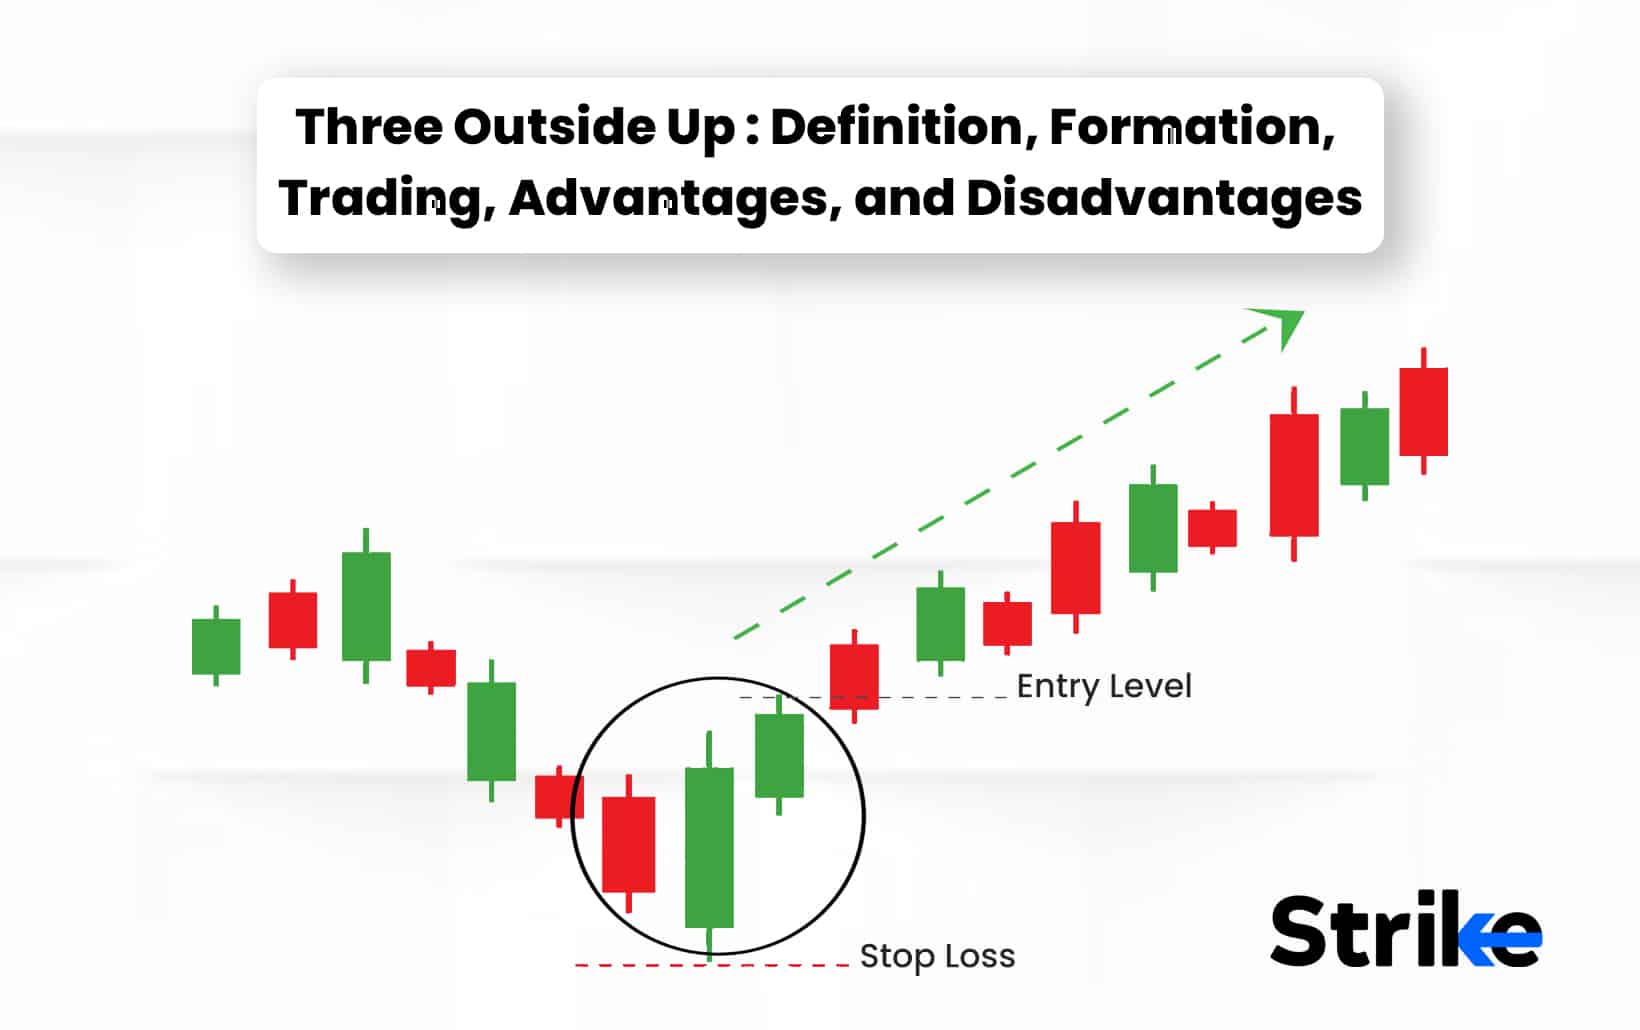
In the above figure, we can see the schematic diagram of the three outside up patterns. We have three consecutive candlesticks here as mentioned above.
The three outside up candlestick patterns frequently occur and serve as a reliable indicator of a trend in reversal. Traders use it as a primary buying or selling signal.
One can observe that the first candle continues to show a bearish trend. The close of the first candle is lower than the open. This indicates a short-selling interest because it increases confidence in the market’s bearish moves. The second candle will be opening lower than the first. It will appear to be reversing the direction of the chart because of its long real body. It displays bull power as the candle crosses through the opening tick of the first candle. This action raises one red flag for any bears who wish to take their profits now and also tighten their stops because of the possibility of a reversal in the market.
One gets further confirmation that the market can experience a reversal in its trends, with the third candle. This happens due to the fact that the security shows gains with the price pretty well above the boundaries of the first candle. The third candle completes the bullish candlestick as described as an ‘outside day’. The trading day comes to a close after the trader observes all three candles. There is an increase in bullish confidence that sets off any buying signals. This is because the asset closes at a new high with the third candlestick.
How is Three Outside Up Candlestick Formed?
The three outside up candlestick forms when the two occurrences of a bullish candlestick, the one that closes higher than it opened follows a bearish candlestick, the one that closes lower than it opened follows.

Three successive candlesticks particularly form the three outside up patterns. Usually, this appears after a bearish trend. The movement of the candles indicates whether a trend reversal is imminent or not. Below we have mentioned the formation of the pattern.
- The market has to decline for the three outside up patterns to appear.
- The first candle of the pattern will be red. This signifies a downward trend.
- It will form a large green candle. It will be long enough so that it can contain the first candle within its true body.
- The third or final candle indicating three outside up has to be green again. However, this candle must close higher than the second one. This depicts that the downward trend is changing direction.
What does Green Three Outside Up Candlestick tell?
Green three outside up candlestick pattern comprises the candlesticks that are green in color. The pattern signals an upcoming uptrend due to the strong buying pressure. These candlesticks do not possess long shadows and these open within the real body of the previous candle in this pattern.
How Important is the Color of the Three Outside Up Candlestick?
The colors of the candles have great significance in three outside up candlestick patterns. The first candle is one short-bodied red candle. This is so because there is in-fighting that is going on among the bulls and bears when the first candle forms. There has to be a prevailing downtrend for the trend to appear. The second one is a large green candle signifying that the situation is now in control of the bulls. The first candle must accommodate within the body of the second green candle.
The second candle is the engulfing one. This justifies that from this point, the bulls will be taking control and defeating the bears. This situation indicates the bullish reversal uptrend. The third candle which is also green in color indicates the upcoming bullish reversal trend. It has a tighter close than the second one. The third candle has to close higher than the second. Actually, the third candle starts a bullish reversal.
When does Three Outside Up Candlestick happen?
We see that the first day ends with a little bearish candlestick, looking at what occurred during the three trading sessions that form the pattern. It actually shows that the bearers are getting exhausted, though it seems like a continuation of the downswing, The weakening momentum of the bears emboldens the bulls to set up and also take control.
A long bullish engulfing candlestick that forms the next trading day, confirms this. This large candlestick speaks a lot regarding the shifting of the market sentiments. The bulls are taking over and starting to dominate after quite a long period of domination by the bears. This signals an upward price movement in the foreseeable future. The third trading day shows another domination of the bulls. This confirms that the bulls have actually taken control of the market direction.
How often does Three Outside Up Candlestick occur?
The three outside up candlestick pattern occurs frequently and serves as a reliable indicator of a reversal. The pattern does not always give a good profit margin, though often found. you can have a net profit of around 5% on average over the long term, as per statistical data.
How to read Three Outside Up Candlestick in Technical Analysis?
A daily candlestick represents the opening, high, low, and closing prices of a market. The rectangular real body is dark in color (red or black) for a price drop and a light color (white or green) for an increase in price. The lines below and above the body are called tails or wicks. They represent the maximum high and low in a day.
The parts of the candlestick taken during technical analysis can signal changes frequently in the direction of a market or highlight significant potential moves that are seen by the candle of the next day.
Some conditions are mentioned below that must be met for the pattern to form well.
- The pattern has to form in a prolonged downswing
- The open price for the candlestick of the second session is lower than the close price of the candlestick of the first session.
- The close price of the candlestick of the second session is higher than the open price of the candlestick of the first session
- The close price of the candlestick of the third session is higher than the close price of the candlestick of the session.
The strength of this pattern increases with the size of the engulfing second candle. The big the engulfing second candlestick is, in comparison to the first bearish candlestick, the pattern is going to be more significant.
How accurate are the Three Outside Up Candlestick in Technical Analysis?
The three Outside Up patterns serve as a reliable indicator of a reversal in a trend. Traders use it as a primary buying and selling signal. Traders use this signal in the context of other indicators. This pattern is best for relatively short holding periods and is useful mostly for short-term trading. Though often found, the pattern does not always give a good profit margin.
The pattern does not necessarily indicate that the direction of the market is confirmed. One needs to look for an overall market movement that is wider than this short-term indicator. It is always wise to pair up the indicator with others when it comes to setting stop losses or booking profits.
When is the best time to Trade using Three Outside Up Candlestick?
The best time frame for the three outside up candlestick is a relatively short holding period ranging from 1 day to 10 days and daily bars. The most common time frame that traders use for trading are the 15-minute candlestick chart and the 5-minute candlestick chart.
How to Trade with Three Outside Up Candlestick in Stock Market?
We have explained below the process of trading with three outside up patterns with the help of a diagram.
- A trader should confirm the overall market condition before trading an asset. A trader must not commit to any position until he/she gets confirmation from other indicators
- A trader should confirm the pattern first when he/she is sure about the trading. At the end of the existing bearish trend when the three candlesticks form, it forms the three candlestick up pattern.
- The trader buys the stock exactly above the high of the third candle. This is done only on the fourth candle. i.e., the candle that comes after the third candle in the pattern.
- The trader purchases the stock above the high of the third candle, as shown in the above diagram. This we have marked by the green line. The stop loss is maintained below the swing low which is exactly below the low of the second candle. This is quite a simple setup. The profit target depends on the trader and it is not fixed beforehand.
- Traders can take the profits when the price reaches the 1:2 risk/reward ratio or based on a predetermined profit percentage target. Traders can also wait till the trend is broken.
Where does the Three Outside Up commonly used?
Traders use the Three Outside Up indicator as the primary buying or selling signal. This is very effective in swing trading. One has to understand how to effectively use it in different market conditions.
Is the Three Outside Up in an Uptrend a Sell Signal?
No, the three outside up in an uptrend is not a sell signal. One can observe that the first candle continues to show a bearish trend. The close of the first candle is lower than the open. This indicates a short-selling interest because it increases confidence in the market’s bearish moves. The second candle will be opening lower than the first.
However, it will appear to be reversing the direction of the chart because of its long real body. It displays bull power as the candle crosses through the opening tick of the first candle. This action raises one red flag for any bears who wish to take their profits now and also tighten their stops because of the possibility of a reversal in the market. This lifts the price above the range of the first candle.
This happens because the security shows again with the price pretty well above the boundaries of the first candle. This completes a bullish outside day candlestick. Increasing bull confidence sets off buying signals. This is confirmed in the scenario when security posted a new high on the third candle.
What are the advantages of the Three Outside Up Candlestick Pattern?
Traders prefer to use this pattern for technical analysis because of the advantages mentioned below.
Customizable infinitely: One candlestick represents any time period of an asset and so they are infinitely customizable.
Lots of information: They are quite an accurate and pure form of charting that simply displays the data in an easy-to-understand and attractive way as these candlesticks represent opens, closes, highs, and lows of a given time frame.
Easy to understand: The candlestick chart makes price data understanding very easy. You can effortlessly formulate a strategy to trade it. They are aesthetically pleasing with customizable outlines and colors available.
Indicators: Maximum indicators perfectly work with the three outside up candlestick patterns.
Market psychology and sentiment: The candlestick charts are a great option to display market sentiment over a given time frame. With various candlestick patterns like Doji patterns, traders can have access to the overall bias over a specific time horizon.
Traders consider the three outside up patterns as a reliable signal, however confirmation from other indicators acts as an added advantage while taking a trade.
What are the disadvantages of Three Outside Up Candlestick?
The three outside up patterns come with limitations as well, six of which have been mentioned below.
Too much information: All trading strategies are not the same. The edge for some strategies can lie in noise elimination of typical trading systems and focus on only one or two things present in the chart. Therefore, the candlesticks will clutter the charts in such trading systems.
Not always accurate: The pattern does not always give a good profit margin though found often. The pattern does not necessarily indicate that the direction of the market is confirmed. One needs to look for an overall market movement that is wider than this short-term indicator. It is always wise to pair up the indicator with others when it comes to setting stop losses or booking profits.
Difficult to identify: Traders will have no idea what came first, the low or the high unless they watch a bar form retrospectively in real-time. They have to go down to the lower time frames to check what happened within that candlestick. A bullish bar on a higher timeframe represents an overall trend on lower time frames and it can also represent a single parabolic move.
Gaps: Candlestick charts come with gaps. Also, there are instances when a candle closes at a certain level and the following candle can open at a different level.
Apophenia: Our brain wishes to see patterns and also look for meaning. When this is combined with technical analysis, we often see patterns in random things and try attaching things where there is nothing to the said data. Candlesticks are often known for this trip.
False confidence: Many of us are often tricked to believe in one-dimensional trading systems using only the price data. This is because the candlestick chart makes price data understanding very easy. You can effortlessly formulate a strategy to trade it.
The above limitations suggest that the outside up indicator is not foolproof and must be used in conjunction with other indicators as well.
What is the Opposite of Three Outside Up Candlestick?
The three outside down candlestick pattern is the opposite of the three outside up pattern and the pattern occurs generally during a bullish trend. The first candle continues the bullish trend having the close higher than the open. This indicates strong buying interest and increases bull confidence. The second candle opens higher but it reverses which crosses through the opening tick displaying bear power.
This price action tells bulls to tighten stops or take profits as a reversal is quite possible. The security continues posting losses seeing its price drop below the first candle’s range. This completes a bearish outside day candlestick. Now, this increases bear confidence setting off a selling signal.
What are other types of Doji Candlestick Patterns besides Three Outside Up?
The five most commonly traded and powerful types of Doji have been mentioned below.
- Standard Doji
- Dragonfly Doji
- Long-legged Doji
- Gravestone Doji
- 4-Price Doji
- Standard Doji
Standard Doji is a single candlestick that does not have much significance of its own. Traders observe the prior price action that builds up to the Doji, to understand what the candlestick means. A Standard Doji with an uptrend can denote to form part of a continuation of the existing uptrend. However, a reversal in the uptrend demonstrates the importance of confirmation after the occurrence of the Doji.
- Dragonfly Doji
Dragonfly Doji type can appear either at the bottom of a downtrend or at the top of an uptrend signaling the potential for a change in direction. No line is there above the horizontal bar. This makes a ‘T’ shape signifying that the price has not moved above the opening price. On this Doji, a very extended lower wick at the bottom of a bearish move is quite a bullish signal.
- Long-legged Doji
Long-legged Doji contains a greater extension of the vertical lines both above the horizontal line and below it. This indicates that throughout the timeframe of the candle price action moved up and down dramatically but closed at the same level virtually that it opened. This depicts the indecision between the sellers and the buyers.
- Gravestone Doji
Gravestone Doji is exactly the opposite of Dragonfly Doji and it appears when the price action opens and closes at the trading range’s lower end. Buyers can push the price up after the candle opens but they cannot sustain the bullish momentum by the close. There is a bearish signal at the top of a move to the upside.
- 4-Price Doji
4-Price Doji is simply a horizontal line having no vertical line present above or below the horizontal. The pattern signifies the ultimate indecision as the open, close, high, and low. All four prices that the candle represents are the same. This unique pattern signifies an extremely quiet market or indecision.
Understanding the different kinds of Dojis will enable traders to implement the knowledge while dealing with Doji candlesticks.
What Candlestick Pattern is Similar to Three Outside Up Candlestick?
Same as the three outside up candlestick pattern, the three inside up pattern is also a bullish reversal pattern. It comprises one large down candle, one smaller up candle that is contained within the prior candle, and another up candle that closes above the second candle’s close.
Is the pattern of the Three Outside Up a bullish reversal?
Yes, the three outside up is a three-candle reversal pattern that appears on the candlestick chart. It is a bullish candlestick pattern that occurs at the end of a downtrend.
What is the difference between Three Outside Up and Three Outside Down?
Both the three Outside Up and Down are three-candle reversal patterns appearing on candlestick charts. The patterns need three candles to form in a particular sequence that the current trend has lost momentum and can signal a reversal of an existing trend. The pattern forms when a bearish candlestick is followed by two cases of a bullish candlestick or vice versa.
The three outside up is a pattern of bullish candlestick having features as mentioned below.
- The market is in a downtrend
- The foremost candle is bearish
- And the second candle is bullish having a long real body and it fully contains the first candle.
- The third candle here is bullish having a higher close than the second candle
The three outside down is a bearish candlestick pattern consisting of features as mentioned below.
- The market is in an uptrend
- The foremost candle is bullish
- And the second candle is bearish having a long real body and it fully contains the first candle.
- The third candle here is bearish having a close lower than the second candle.
The first candle marks the start of the end of the prevailing trend because the second candle engulfs the first candle. Then, the third candle depicts an acceleration of the reversal.
Both the three Outside Up and the three Outside Down frequently occur and traders consider these as reliable indicators of a reversal. They use these indicators as primary selling or buying signals.


 Previous Article


: Meaning, 5 Types, Trading Strategy with Example, Win Rate 14")

 2026: Features, Pros vs Cons, Pricing, Reviews, Is It Worth It? 16")
 2026: Features, Pros vs Cons, Pricing, Reviews, Is It Worth It? 17")
 2026: Features, Pros vs Cons, Pricing, Reviews, Is It Worth It? 18")

 : Definition, Formula, calculation, Uses, Advantages Vs limitations 22")


No Comments Yet.