Pivot Points: Definition, Formula & Calculation, Types, Trading Guide, Limitations


Pivot points are a technical analysis tool utilized by traders to identify potential support and resistance levels in the market. Pivot points provide objective reference points calculated using the prior trading period’s high, low, and close prices. Specifically, the pivot point is determined by taking the average of these three values. From that central level, additional horizontal zones are then derived showing where prices may pause or potentially reverse course.
Monitoring price action as it tests these identified levels helps traders gain insights into how market participants may react at specific price thresholds. In a bullish market, buyers may choose to enter or accumulate positions as prices retreat to pivot support. Conversely, in a bearish market, short-term sellers may choose to take profits or initiate new short positions at pivot resistance overhead. While pivot points alone do not guarantee future market movements, incorporating them into a structured analysis framework allows traders to strategically plan areas of interest and manage risk.
What is a pivot point?
A pivot point is a technical indicator traders use to identify potential support and resistance levels. A pivot point is calculated using the previous day’s open, high, low, and closing prices. The pivot point is the average of the high, low, and closing prices. It is considered bullish and sometimes finds support at the pivot point during pullbacks if the market trades above the pivot point. It is considered bearish and sometimes finds resistance at the pivot point during rallies if the market trades below it. Pivot points are used on all time frames to determine the overall market trend.
Traders often use pivot points with other indicators to make trading decisions, identify trends, and find potential support and resistance levels for a security. The simplicity of the pivot point calculation makes it a useful and popular trading tool for determining market direction. Pivot points are largely used by short term traders to identify appropriate trading opportunities. Pivot points are also used in algorithmic coding that is used extensively by derivative traders.
What is the formula for calculating pivot points?
The formula for calculating pivot points is
Pivot point (P) = (Previous High + Previous Low + Previous Close)/3
S1= (P x 2) – Previous high
S2 = P – (Previous High – Previous Low)
R1 = (P x 2) – Previous Low
R2 = P + (Previous High – Previous Low)
Where,
S1= Support 1
S2 = Support 2
R1 = Resistance 1
R2 = Resistance 2
What are the types of pivot points?
The five types of pivot points are classic, woodie, DeMark, camarilla, and Fibonacci.
Classic pivot points

Classic pivot points are calculated using the previous trading day’s high, low and closing prices. The pivot point is calculated as (previous high + previous low + previous close) / 3. The resistance levels are then calculated as R1 = (2 x Pivot Point) – previous low and R2 = Pivot Point + (previous high – previous low). The support levels are calculated as S1 = (2 x Pivot Point) – previous high and S2 = Pivot Point – (previous high – previous low). These formulas generate the pivot point as well as two resistance and support levels above and below it.
Traders look for bounces off these classic pivot levels to enter or exit positions, making them useful reference points for trading strategies across all timeframes.
Woodie pivot points

Woodie’s pivot points were developed by trader Ken Woodie and are calculated using the open, high, low and close of the previous trading day. The central pivot point is calculated as (High + Low + 2*Close)/4. The upper and lower pivot levels are then calculated as (Central pivot + High + Low)/3 and (Central pivot – High + Low)/3. Additional levels are also calculated by adding or subtracting multiples of the range between the high and low. Woodie’s pivots aim to simplify analysis by framing trades between key support and resistance zones. Traders look for bounces and breaks of these levels to time entries and exits. The simplicity of Woodie’s method makes it popular for intraday trading across stocks, forex and derivatives (Futures & Options).
DeMark pivot points

DeMark pivot points are a unique type of pivot that incorporates data from the previous two trading days. They were developed by noted technician Tom DeMark and utilize the open, high, low and close prices. The calculations start with the range between the prior day’s open and today’s open. Pivot points are then plotted at 1/4, 1/2 and 3/4 of this range above and below today’s open price. Additional levels are calculated similarly using the range between the prior day’s close and today’s close.

DeMark pivots generate clusters of potential turning points around the open price rather than a central pivot point. Traders look for breaks above or below these DeMark pivots to signal new intraday ranges and potential continuations or reversals. The incorporation of the extra day’s data aims to improve accuracy. As a result, DeMark pivots are widely used by active intraday traders across various markets.
Camarilla pivot points

Camarilla pivot points are a popular type of intraday pivot used by technical traders to identify key levels of support and resistance. They were developed by Nick Scott and are calculated using the high, low and closing prices from the previous day. The range between the high and low prices is divided into eight equal parts. Pivot points are then plotted at the 1/4, 1/2, and 3/4 marks of this range added to the close price. This generates clusters of potential turning points above and below the close price.
Additional levels are also calculated at 1/8 and 7/8 marks of the range. The advantage of Camarilla pivots is they identify more potential pivot levels than classic pivots. Traders look for bounces, breaks and rejections around Camarilla pivots to time executions. This makes them an effective math-based tool for intraday trading strategies across stocks, derivatives (Futures & Options) and forex.
Fibonacci pivot points

Fibonacci pivot points are a variation that incorporates Fibonacci ratios into the pivot point calculations. The central pivot point is calculated using the standard formula of (High + Low + Close) / 3. Then the support and resistance levels are calculated by multiplying the previous day’s high-low range by key Fibonacci ratios like 0.382, 0.5, 0.618 and 1.0. For example, R1 = (Prior High – Prior Low) x 0.382 + Pivot Point. These levels aim to plot potential reversal points at areas that adhere to Fibonacci theory.
The advantage is they incorporate more subjective analysis rather than just objective math. Traders look for bounces, breaks and rejections off these Fibonacci pivots to time executions and determine intraday bias.
Why you should understand the pivot point?
You should understand pivot points because they are potential support and resistance levels where the direction of a stock’s price sometimes changes. They serve as alert levels for possible reversals or breakouts when the price reaches a pivot point. This allows you to anticipate and react faster.
Scalping is a style of trading that involves entering and exiting trades within minutes. Pivot points offer scalpers opportunities to capture these high probability trading signals. Traders add multiple indicators and engage in multi-time frame, candlestick and price action analysis to solidify a trading plan produced by watching these pivot points.
Trading off pivot points allows you to take advantage of short-term price oscillations as support and resistance levels are tested. Monitoring multiple time frame pivot points gives a broader market perspective. The more context, the better.
How to trade with pivot points?
Pivot points are traded by looking for bounces and breakouts from key levels. The main pivot level is calculated using the previous day’s high, low and close. The key is watching price action when the current price approaches a pivot point. For example, if a stock price is trending down towards a main pivot support, you would look for signs of buying interest and a bounce higher off that level. You could enter a long position with a stop loss below the pivot, targeting overhead resistance if the price holds and starts to rally on increased volume.
On the flip side, if the price is rising into an overhead pivot resistance level, you would watch for signs of selling pressure. You could enter a short position with a stop above the old pivot level if the stock breaks downward through the pivot decisively on heavier volume. The ability to enter a pivot point bounce trade quickly when you detect a reversal relies on being alert to pivotal zones ahead of time. You also have to manage risk since breakouts sometimes fail. Define exits for stopped out or losing trades before entering.
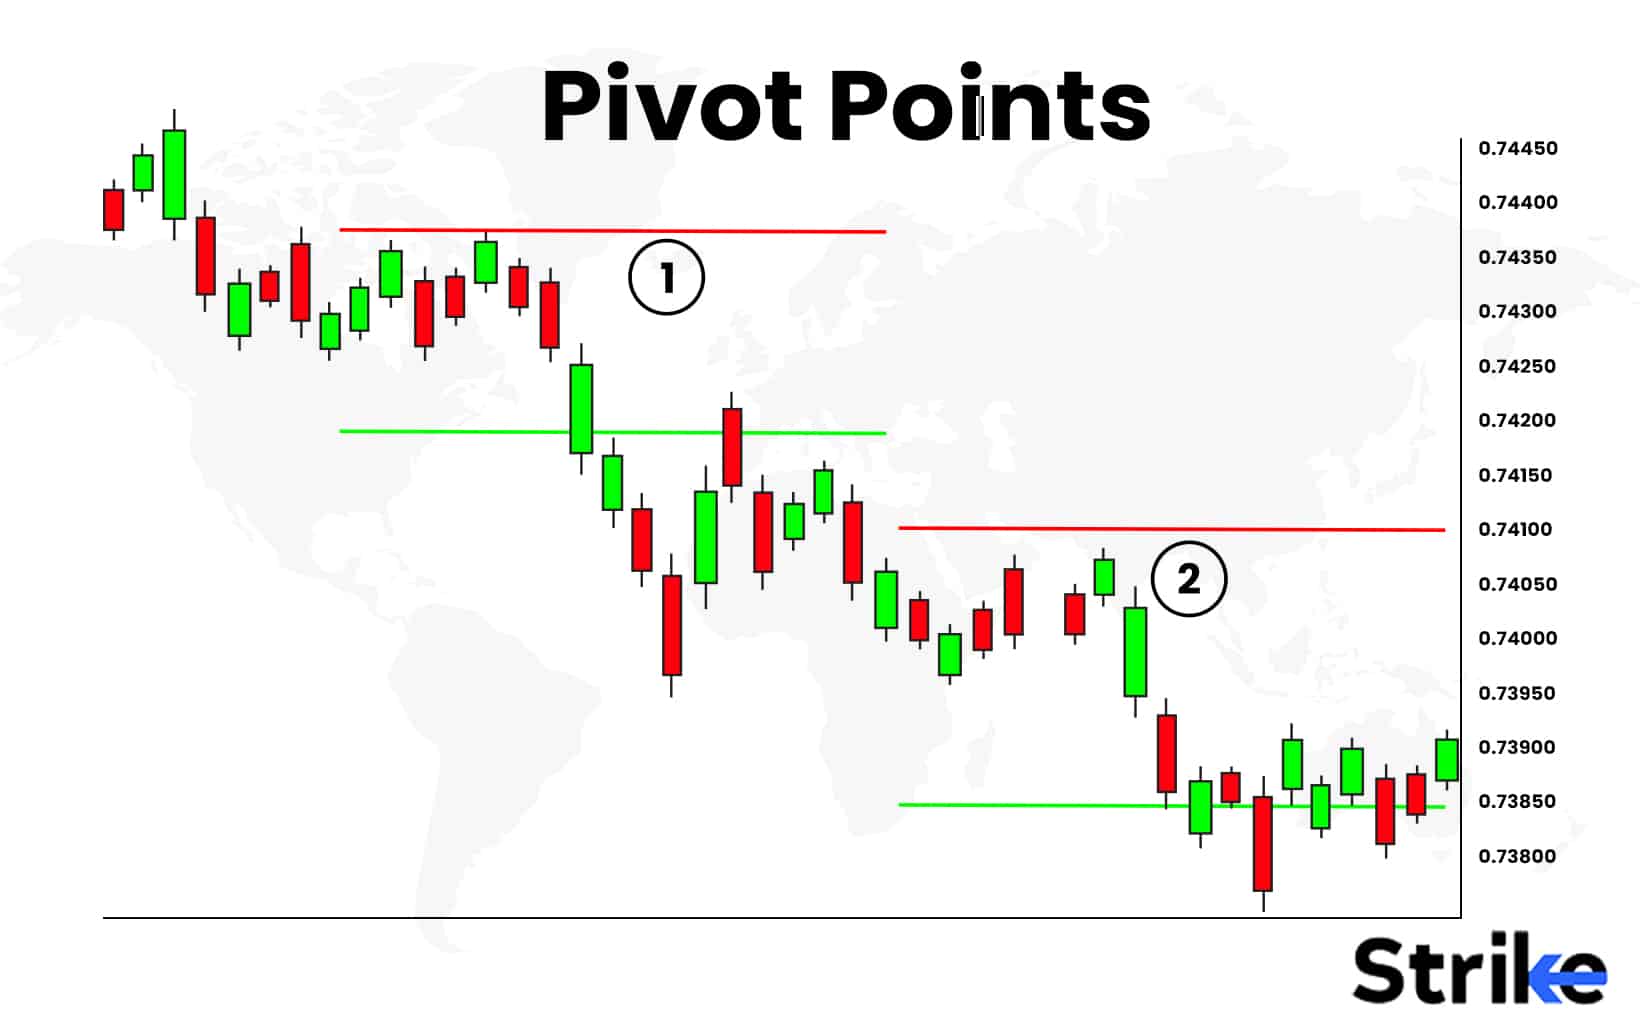
An example of how pivot points can be used to take trades is showcased in the image attached below: Observe how the pivot points were able to generate trade signals. By digging into lower time frames, day traders could have figured out a solid entry of long and short trades on these price points. It is important to note that these points offer solid objective projection of future price movements. The breakout and reversal trades can be spotted by observing the pivot points.

Why do intraday traders prefer pivot points?
Intraday traders prefer pivot points because they provide significant potential support and resistance levels throughout the day. Having key levels identified ahead of time allows intraday traders to plan ahead, set alerts, and be ready to react swiftly to price-reaching pivots. They offer clear price targets for entries and stops for active intraday setups and reversals. Pivot points also help intraday traders and scalpers quantify risk since they know the exact points that invalidate a setup if breached.
Traders add multiple indicators to confirm a particular price point, if more confluences are gathered from candlestick patterns and price action analysis, traders create a suitable trading plan and take bets based on signals generated by the combination of indicators. In fast-moving markets or volatile, pivots stand out as reference points amid short-term noise. Their calculation using just three simple data points makes them quickly adaptable each day. In the chart uploaded below, one can see a two day action of Nifty Bank Index on a 5 min time frame. The yellow lines are the pivot points.

Which pivot points are best for intraday?
For intraday traders, the main pivot point, support 1 and resistance 1 are the most popular and reliable levels to trade from. The main pivot is the primary intraday reference point, derived from the previous day’s range. Support 1 and resistance 1 are derived directly from the main pivot and represent key potential reversal zones. They provide the tightest and most significant areas for intraday setups to form. The other minor pivots (S2, S3, R2, R3) are usually too wide from the main pivot for most intraday purposes.
While they still be useful, relying on just the main and first support/resistance pivots simplifies analysis for rapid intraday decisions. Traders often plot mechanical support and resistance levels based on price action, if the pivot points complement these mechanical levels, the qualification of a trading setup is assumed to be high as the chances of potential trading activity will be higher. Traders will also combine other intraday indicators like Fibonacci levels, trendlines and volume price analysis with their pivot setups. But overall the main, S1 and R1 pivots give the most bang for the buck.
What are the limitations of pivot points?
Limitations of pivot points in the stock market include the lack of predictive power, as they are based on past price data and sometimes do not always accurately predict future price movements. Pivot points are best used with other technical analysis tools. Additionally, market dynamics impact the effectiveness of pivot points, as markets with low liquidity or news events causing extreme volatility and price gaps sometimes render pivot levels unreliable. Due to their popularity, the overuse of pivot points makes them self-fulfilling prophecies, leading to crowded trades and potential reversals when too many traders rely on the same levels. If more traders use the same methodology, in this case, pivot points, the accuracy of the same starts decreasing as the traders become prone to manipulation and stop hunts.
Moreover, pivot points are primarily designed for intraday and short-term trading, so they sometimes do not provide meaningful insights for long-term investors or swing traders focused on larger price trends. Variations in pivot point formulas used by different traders also lead to differences in identified support and resistance levels, making it important to understand the specific formula being utilized to avoid confusion. While useful, pivot points have limitations like any single indicator, so they should be applied cautiously as part of a robust trading approach utilizing multiple strategies. Traders should understand these limitations before relying too heavily on pivot points in the stock market. Using pivot points prudently as part of a broader analysis optimizes their usefulness.
What timeframe is best for pivot points?
Timeframes best for pivot points are short intraday periods, as they were designed for short-term trading and analysis. The most suitable timeframes are the 1-minute, 2-minute, and 5-minute intervals. These short durations allow pivot points to be most effective, as they pinpoint intraday support and resistance levels based on price action. The levels derived from pivot point formulas reflect the previous day’s trading range, so they are optimized for near-term intraday use. Longer timeframes like hourly or daily charts are less ideal for pivot points, as broader trends dominate on these scales. For swing trading or long-term investing, pivot points offer limited value.
Do pivot points really work?
Yes, pivot points do work, but they have limitations. In the stock market, pivot points are based on a simple calculation using the previous day’s data, which generates support and resistance levels to watch. Some active traders find these levels useful for very short-term intraday trading. Traders may confirm the price points reflected by the pivot points by finding support and resistance levels derived mechanically through price action. The possibility of working increases if more and more confluences confirm a specific price point for trade setups. Appropriate risk management must be incorporated in whatsoever circumstances.
However, there is no assurance that the price will actually stop at, reverse at, or even reach the levels shown on the chart. The levels are not magical barriers the price must obey. Sometimes the price will move up and down through a pivot point multiple times. Other traders sometimes find pivot points have little predictive value and do not find them useful. The levels become self-fulfilling prophecies if too many traders watch the same points.
How accurate are pivot points?
Pivot points have decent accuracy for intraday trading in the stock market, but their reliability varies. The pivot point is considered one of the more accurate technical indicators for short-term trading by some traders. This explains why many active day traders utilize pivot points to help determine potential trade entry or exit levels. The accuracy comes from pivots’ reliance on basic price action and mathematical calculations using the previous period’s range. This pinpoints key intraday support and resistance areas. However, accuracy is not perfect or consistent.
During volatile markets or news events, prices sometimes surge past pivot levels without hesitation. Pivots also lack predictive power on their own, simply identifying potential turning points based on the prior day. Using pivot points together with other indicators like volume and chart patterns improves accuracy. But there are no guarantees price action will precisely validate the pivot levels.
What is the difference between pivot point & Fibonacci retracement?
The difference between pivot points and Fibonacci retracements is in how they are calculated and what they represent on a stock chart. Pivot points are leading indicators calculated from the previous day’s high, low and close to identify potential support and resistance levels. In contrast, Fibonacci retracements are lagging indicators calculated based on a stock’s prior move to highlight possible retracement levels. Pivot points have more predictive qualities, forecasting future reversal points based on past data. Meanwhile, Fibonacci retracements are reactive, identifying possible pullback levels after a substantial price move has already occurred.
Additionally, pivot points provide horizontal support and resistance levels across a period like a trading day. Fibonacci retracements yield diagonal dynamic levels that respond to ongoing price swings. While both indicate areas of interest on a chart, pivot points are optimized for intraday range trading while Fibonacci levels are better suited for broader directional moves. Traders sometimes use pivot points and Fibonacci retracements together, but they serve different purposes – pivot points for near-term turning points and Fibonacci levels for deeper retracements. Understanding these key differences allows traders to apply them most effectively.


Share


No Comments Yet