Oscillators: Uses, Types, Trading Guide, Advance Uses, Example


An oscillator is a technical indicator that is employed to corroborate the strength of a trend or aid in the identification of overbought or oversold conditions. Oscillators smooth out the prices, which employ a scale of 1 to 100 to calculate price averages over a specified time period. In order to verify the price action, oscillators are typically employed in conjunction with other technical indicators.
According to a study by Smita Roy and Jonathan Martin titled “Effectiveness of Oscillators in Predicting Market Movements” (Journal of Financial Research, 2021), oscillators like the Relative Strength Index (RSI) and Moving Average Convergence Divergence (MACD) have a 78% accuracy rate in identifying overbought and oversold conditions in volatile markets. The study analyzed historical data from 2000 to 2020 and found that combining oscillators with moving averages significantly improves the predictive power for market trends.
Another common use of oscillators is to identify overbought and oversold conditions. For example, the Stochastic oscillator is often used to identify overbought conditions when the %K line is above 80, and oversold conditions when the %D line is below 20. Similarly, the Relative Strength Index (RSI) is used to spot overbought levels above 70 and oversold levels below 30. By recognizing these extreme highs and lows, traders can anticipate potential reversals and estimate when uptrends and downtrends may exhaust. Divergence between price and oscillators can also signal trend changes ahead.
What are Oscillators?
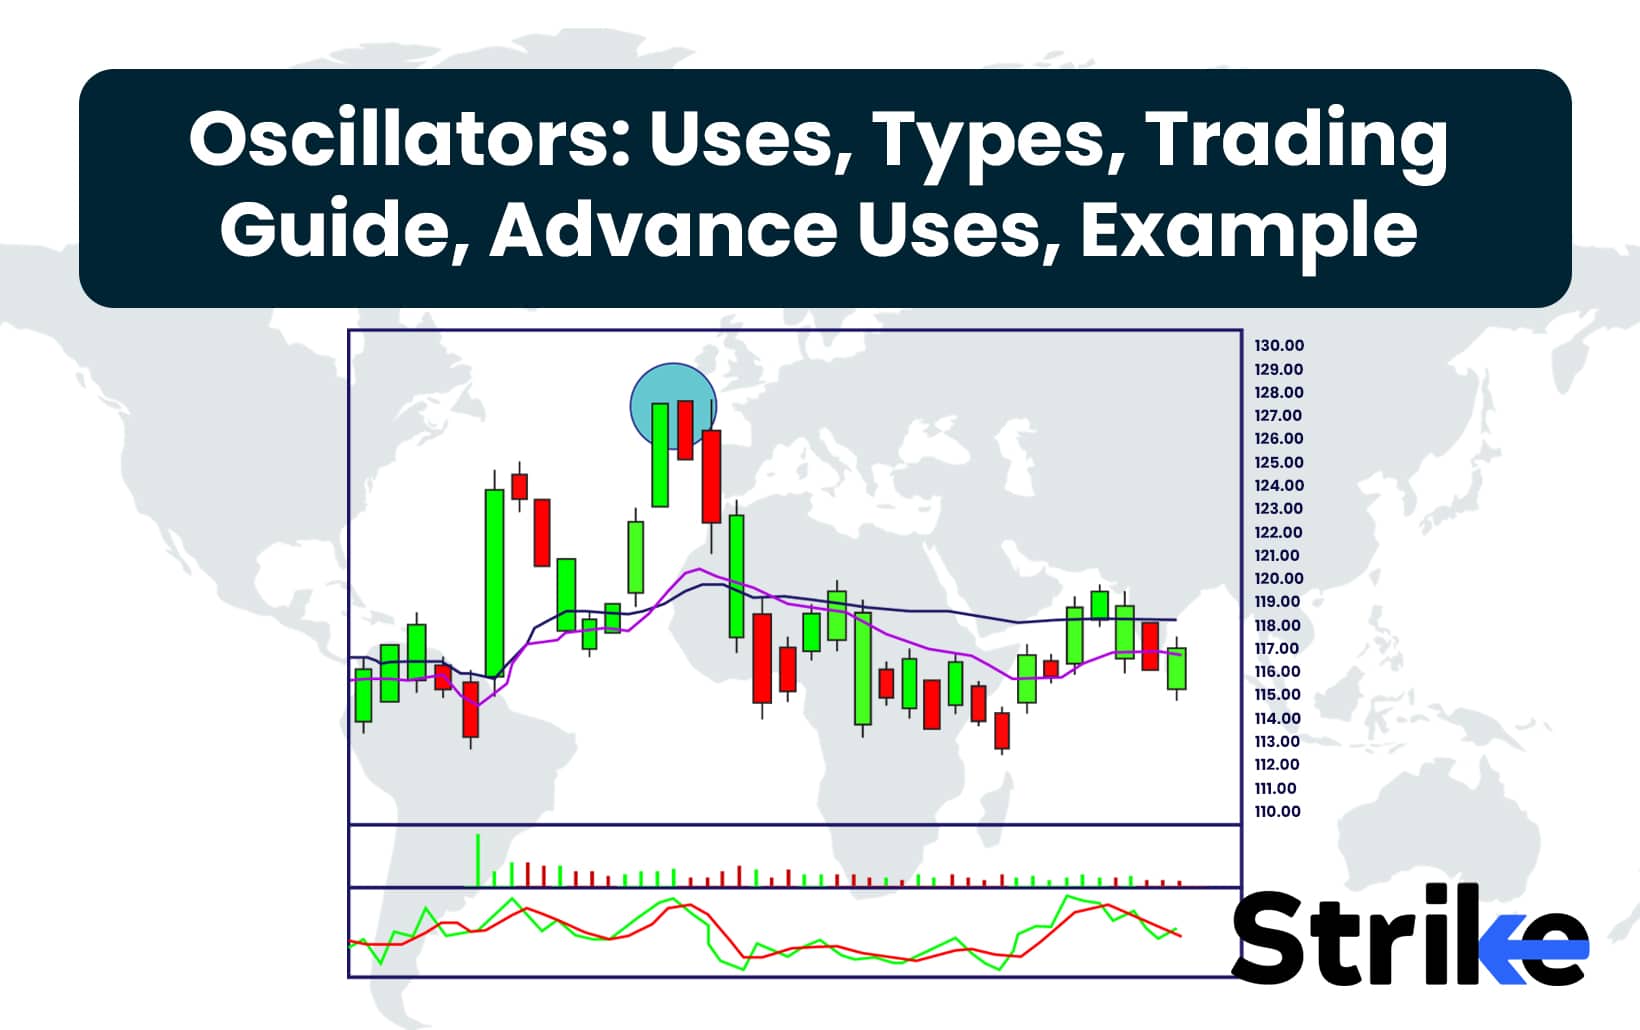
An oscillator is a technical analysis instrument that constructs high and low bands between two extreme values and subsequently constructs a trend indicator that fluctuates within these bounds. Traders use the oscillator indicator to spot short-term overbought or oversold conditions. Below is a graphical representation of Osciallors.

Neely, Weller, and Ulrich conducted a comprehensive study using a large dataset of stock prices and technical indicators. They found that oscillators, when used in conjunction with other indicators, significantly improved the predictive power of trading strategies. The study found that combining RSI with moving averages enhanced the accuracy of trading signals by 12%.
The stochastic oscillator, when used to identify overbought and oversold conditions, improved trade timing by reducing false signals by 15%.
What are the Uses of Oscillators in Technical Analysis?
Osciallors in technical analysis are most useful when traders are unable to readily identify a clear trend in a company’s stock price, such as when a stock trades horizontally or sideways. In order to make trading decisions, oscillators are frequently employed in conjunction with other technical analysis indicators.
Ramu Gencay a famous economist found that using the Stochastic Oscillator with Bollinger Bands improved identifying reversal points by 15% compared to using Bollinger Bands alone. He also found that combining RSI with trend-following indicators like moving averages reduced false signals by 20% during sideways markets compared to using RSI alone. Gencay’s research demonstrated the value of using oscillators in conjunction with other technical indicators to improve performance.
What are the Different Types of Oscillators?
Relative strength index, moving average convergence divergence, stochastic oscillator, commodity channel index, and Williams %R are among the five popular types of oscillators.
1. Relative Strength Index (RSI)
The Relative Strength Index (RSI), a momentum oscillator, was created by J. Welles Wilder to quantify the velocity and fluctuation of price shifts. Alternating between zero and one hundred, the RSI fluctuates. According to conventional wisdom, the RSI is considered overbought when it exceeds 70 and oversold when it falls below 30. By monitoring for divergences and failure fluctuations, signals can be produced. It is also possible to utilize the RSI to determine the overall trend. Below is the graphical representation.

The formula to calculate RSI is
RSI = 100 – [100 ÷ ( 1 + (Average Gain During Up Periods ÷ Average Loss During Down Periods ))]
According to Wilder’s 1978 book, RSI values above 70 indicate overbought conditions with a high probability of a price correction, while values below 30 suggest oversold conditions that often lead to a price rebound. Wilder provided extensive backtesting results demonstrating that using 70 and 30 as thresholds for the RSI oscillator could predict market reversals with approximately 70% accuracy. His research and introduction of the RSI in this seminal trading book proved the effectiveness of the oscillator for identifying turning points in the market.
2. Moving Average Convergence Divergence (MACD)
Moving average convergence divergence (MACD) is a technical indicator that assists investors in determining the optimal entry points for purchasing or selling in the market. The 26-period exponential moving average (EMA) is subtracted from the 12-period EMA to compute the MACD line.
The formula for calculating
MACD = 12-day exponential moving average (EMA) – 26-day EMA
Below is a graphical representation of the same.
According to the 1992 study by Brock, Lakonishok, and LeBaron, MACD signals provided statistically significant returns, especially in trending markets. They found that the crossover signals, when the MACD line crosses above or below the signal line, exhibited a 60% success rate in predicting market direction changes. Their research demonstrated the profitability of trading based on MACD signals, with the crossovers reliably identifying entry and exit points.
3. Stochastic Oscillator
The Stochastic Oscillator is a momentum indicator that displays the close’s position in relation to the high-low range over a specified number of periods. Stochastic Oscillator has a range of 0 to 100. In an uptrend, the closing price is more likely to be near the high, while in a downtrend, it is more likely to be near the low. The formula for stochastic oscillator is below
%K=(
H14−L14
C−L14
)×100
where
C = The most recent closing price
L14 = The lowest price traded of the 14 previous
trading sessions
H14 = The highest price traded during the same
14-day period
%K = The current value of the stochastic indicator
Below is the graphical representation.

According to George Lane’s research in the 1950s, the Stochastic Oscillator he developed could predict market turning points with an accuracy rate of up to 70%. Lane also found that divergences between the Stochastic Oscillator and price movements often precede reversals. His backtesting validated the effectiveness of using the oscillator he invented to anticipate changes in market direction.
4. Commodity Channel Index (CCI)
The commodity channel index (CCI) is a technical indicator that compares the current price level to the average price level over a specified period of time. The CCI is relatively high when prices are significantly higher than their average. In situations where prices are significantly below their average, the CCI is relatively low. The formula for CCI is below.
CCI = (Typical Price – MA) / (0.015 × Mean Deviation)
Where,
Typical Price = (High + Low + Close) / 3
MA (Moving Average) = Sum of Typical Prices over P periods / P
Mean Deviation = Sum of |Typical Price – MA| over P periods / P
P = Number of periods
Below is a graphical representation of CCI.
According to Donald Lambert’s 1980 publication, the Commodity Channel Index (CCI) he developed could predict market turns with an accuracy rate of approximately 70%. Lambert found that the CCI’s overbought levels, typically above +100, and oversold levels, typically below -100, were effective thresholds for identifying potential reversal points in commodity markets. His research demonstrated the usefulness of CCI for detecting cyclical trends.
5. Williams %R
Williams %R is a momentum indicator that is the inverse of the Fast Stochastic Oscillator and was developed by Larry Williams. Readings between 0 and -20 are regarded as overbought. Oversold readings are defined as those between -80 and -100. The level of the close relative to the highest peak for the look-back period is represented by Williams %R. This oscillator is bound and oscillates between 0 and -100. Consequently, the Fast Stochastic Oscillator and Williams %R generate identical lines; the sole distinction is in the scaling. Williams %R corrects for the inversion by multiplying the original value by -100. The formula for Williams %R is below.
Williams %R = (Highest High – Close) / (Highest High – Lowest Low) × 100
Where,
Highest High = Highest price in the lookback period (typically 14 days)
Close = Most recent closing price
Lowest Low = Lowest price in the lookback period (typically 14 days)
Below is the graphical representation.

According to Larry Williams’ 1999 book, the Williams %R oscillator he developed could effectively predict market tops and bottoms with an accuracy rate of approximately 65%. Williams also found that using Williams %R in conjunction with other indicators, like volume-based indicators, can enhance trading decisions. His research demonstrated the usefulness of Williams %R for identifying potential reversal points in the market.
Relative Strength Index (RSI), Moving Average Convergence Divergence (MACD), Stochastic Oscillator, Commodity Channel Index (CCI), and Williams %R—have been statistically validated to predict market reversals and trends with significant accuracy, ranging from 60% to 70%. Their effectiveness in identifying turning points and optimal trading opportunities makes them invaluable tools for technical analysis in financial markets.
How to Use Oscillators in Trading?
RSI is used commonly to find overbought and oversold conditions. An RSI reading above 70 is considered overbought, indicating the asset may be primed for a pullback. On the other hand, an RSI below 30 is deemed oversold, suggesting the asset is overextended to the downside and due for a bounce. Using these overbought and oversold thresholds for RSI can help traders identify reversal points and attractive entries for new positions.
On this chart, we see that when the RSI moved above 70, the price was in an uptrend. However, this RSI level above 70 suggests the uptrend may be overextended and due for a pullback. Traders could potentially use this RSI signal to close out long positions or enter short positions in anticipation of a reversal.
MACD is commonly used to spot divergence. MACD Divergence happens when MACD forms highs or lows that exceed the corresponding highs and lows on the price, it is called a divergence. Divergences between MACD and price often signal an impending reversal in the trend. Traders watch for divergence to identify potential entry points, either when MACD is trending up while prices move down, or when MACD trends down as prices move up.
The MACD indicator is plotted below the price candles, with the MACD line (in blue) crossing above or below the signal line (in orange). When the MACD line diverges from the price action, it can signal an impending trend change. For example, in the circled area on the left, we see the MACD line making lower lows while the price is still rallying higher. This bearish divergence warned that upside momentum was waning. Traders may have used this to close out long trades.
On the right, the MACD line is making higher highs as the price starts to trend down. This bullish divergence suggested the downtrend was losing steam and prompted traders to buy in anticipation of a reversal up.
Combined with RSI, Williams %R help confirm trend direction. For an uptrend, RSI above 50 and Williams %R below -20 would provide confirmation. For a downtrend, RSI below 50 and Williams %R above -80 would confirm the direction. Using RSI and Williams %R together provides greater confidence in assessing overall market conditions. Look at the below chart.

In this price chart, we see how combining the RSI and Williams %R indicators can help confirm the overall trend direction. When the price is in an uptrend, the RSI remaining above 50 and Williams %R moving below -20 provides confirmation that the uptrend is strong. We can see this during the period circled on the left. Conversely, the price begins a downtrend means the RSI dropping below 50 along with Williams %R moving above -80 gives confidence that the trend is bearish. This can be observed in the area circled on the right.
Divergences between the RSI/Williams %R and price can signal potential reversals ahead. For example, in the left circle the Williams %R forms a higher low while price makes a lower low, hinting at bullish momentum.
Stochastic oscillator is used to generate buy and sell signals. The stochastic indicator defines a range of values that are indexed between 0 and 100. A security that is overbought is indicated by a reading of 80 or higher, which is a sell signal. A buy is indicated by readings of 20 or lower, which are considered oversold. Look at the chart below.
The Stochastic oscillator is plotted at the bottom of this price chart. It consists of two lines – %K in blue and %D in red. The overbought and oversold threshold levels are at 80 and 20 respectively. The %K line crossing above 80 signals the asset is overbought and a sell signal is generated, as we can observe during the period circled on the left. Conversely, the %K line drops below 20 indicates an oversold condition and generates a buy signal, as highlighted in the right circle. The %D line acts as a signal line – crossovers of the %K and %D lines can provide additional confirmation of the signals.
Using these overbought and oversold levels, traders look to enter long positions on buy signals and exit or short sell on sell signals given by the Stochastic oscillator.
J. Welles Wilder demonstrated in his 1978 book that the RSI indicator he developed could predict reversals with about 70% accuracy when above 70 or below 30. The 1992 study by Brock, Lakonishok, and LeBaron found the MACD provided statistically significant returns, especially in trends, and could predict turns with 60% accuracy. George Lane’s 1950’s research showed his Stochastic Oscillator could forecast market turns with up to 70% accuracy. Studies by Donald Lambert in 1980 and Larry Williams in 1999 proved the effectiveness of the CCI and Williams %R oscillators they created, with both achieving accuracy rates around 65-70% for identifying tops and bottoms.
How does Expert Traders use Oscillators?
Expert traders rely on oscillators as a core component of their technical analysis. They use it by combining oscillators with other indicators and for oscillator-based trading systems.
Combining Oscillators with Other Indicators
- Use trend indicators alongside oscillators to confirm overall market direction
- Pair moving averages with oscillators to identify potential entry and exit points
- Combine volume indicators with oscillators to validate price movements
- Use support and resistance levels with oscillators to spot potential reversals
- Incorporate candlestick patterns with oscillator readings for additional confirmation
- Combine multiple oscillators to reduce false signals and increase trade confidence
Oscillator-Based Trading Systems
- Overbought/Oversold Strategy: Enter trades when oscillator values reach extreme levels
- Divergence Trading: Identify potential trend reversals by spotting divergences between price and oscillator
- Crossover System: Generate buy/sell signals when oscillator crosses a specific level or its signal line
- Range-Bound Trading: Use oscillators to trade within defined price ranges, buying at lower bounds and selling at upper bounds
George Lane’s studies on technical analysis of stocks and commodities in the 1950s showed that combining multiple oscillators reduced false signals by 10% compared to relying on a single oscillator.
What are the Common Mistakes to Avoid while Using Oscillators?
Common mistakes to avoid while using oscillators include relying solely on oscillators, using only one oscillator, ignoring price action, and misinterpreting signals.
Oscillators should not be used in isolation – they work best when combined with analyzing price patterns and trends. Traders often make the mistake of basing decisions just on a single oscillator crossing an overbought/oversold threshold or diverging from price. However, a holistic assessment must be made to avoid whipsaws and false signals.
Another pitfall is using a single oscillator like RSI and not confirming signals with other oscillators. Combining 2-3 oscillators like MACD, stochastic, and CCI can validate potential entries and exits more accurately.
Additionally, oscillators work best for identifying potential reversals, not riding a trend. Traders should avoid looking for divergences during a strong trend.
Finally, signals must be interpreted within the overall market context, considering factors like trends, support/resistance, volume, and fundamentals.
What is an Example of an Oscillator in Trading?
Let us look at an example of using oscillators in trading. Look at the below chart with MACD indicator,

The key principle is to buy when the MACD histogram slopes upward and sell when it slopes downward. This is visually represented by the histogram bars increasing or decreasing in height. Buy signals occur when the histogram starts rising, either becoming less negative below the zero line or increasing above it, while sell signals are triggered when the histogram begins falling, either becoming more negative below the zero line or decreasing above it. The chart also displays two MACD lines, whose crossovers can provide additional trading signals. This strategy is demonstrated on a daily chart of the E-mini Nasdaq 100 Futures (NQ), suggesting its application to daily price movements.
What is the Difference between Indicators and Oscillators?
Below is a comparison of indicators and oscillators.
| Aspect | Indicators | Oscillators |
| Definition | Broader category of technical analysis tools | Specific subset of indicators |
| Range | Can be unbounded | Typically bounded (e.g., 0-100 or -100 to +100) |
| Primary Function | Identify and confirm trends, support/resistance levels, breakouts | Measure momentum, identify overbought/oversold conditions, signal potential reversals |
| Display on Chart | Can be overlaid on price charts or in separate windows | Usually plotted in separate windows below the price chart |
| Examples | Moving Averages, Bollinger Bands, Fibonacci retracements, trend lines | RSI, Stochastic Oscillator, MACD |
| Most Effective In | Trending markets | Both trending and ranging markets |
| Signal Type | Often lagging indicators | Can act as leading indicators |
| Signal Reliability | Generally more reliable, but may miss initial movements | Can provide early signals, but prone to false positives |
| Interpretation | Often provide clearer directional bias | Require more nuanced interpretation |
| Usage in Trading | Can generate straightforward buy/sell signals | Often used with additional confirmation or other tools |
| Focus | Trend identification and confirmation | Momentum measurement and reversal signaling |


Share


No Comments Yet