


Know Sure Thing (KST) is a technical indicator used in stock market analysis to calculate the price momentum for different price cycles. Know Sure Thing ( KST ) is a momentum oscillator developed by Martin Pring. It helps to interpret the market rate conditions with ease.
Know Sure Thing indicator is the summed version of multiple exponential moving averages taken over multiple timeframes and depending on the trader’s preferences. There are two types of KST indicators – the short KST and the Long KST. This classification is purely based on the chosen timeframe. Depending on the KST Line crossovers the market trends can be identified and categorised as bearish and bullish trends.
Know Sure Thing indicator like most other technical indicators offers its advantages and disadvantages. The major advantages of the KST indicator include: A smoothed measurement of price momentum by combining multiple moving averages, Trend Reversal Identification, Divergence Detection, Versatility in Timeframe Usage etc.
What is Know Sure Thing (KST)?
Know Sure Thing is a technical analysis tool that helps in calculating the price momentum for different price cycles. Know Sure Thing ( KST ) is a momentum oscillator developed by Martin Pring. It helps to interpret the market rate conditions with ease.
Know Sure Thing helps the chartist to understand single-line crossovers, centerline crossovers and divergences. The crossover in a trading chart is the intersection of the technical indicator line with the security prices. KST helps in the identification of major trend reversals and generates buy/sell signals for the commodities.
Chartists, traders and market analysts use the KST indicator to identify bullish or bearish divergences between the indicator and the price chart. A bullish trend occurs when the KST line crosses above its signal line, it generates a buy signal. The buy signal denotes the bullish trend. A cross below the signal line generates a sell signal, indicating a bearish trend. KST is used as a tool to reflect short-term and long-term market trends.
Who created the Know Sure Thing (KST) Indicator?
Martin J. Pring, a prominent technical analyst, author, and educator, developed Know Sure Thing. Martin J. Pring is well-known for his contribuWho created the Know Sure Thing (KST) Indicator?
tions to the field of technical analysis and has written several books on the subject. Technical Analysis Explained is one of his books. This book covers various technical analysis techniques, including the Know Sure Thing (KST) indicator. Pring first described the indicator as a Summed Rate of Change (KST) in Stocks & Commodities magazine (1992).
The KST indicator provides a comprehensive view of market momentum and identifies trend reversals. The KST calculation incorporates multiple exponential moving averages (EMAs). It also uses various timeframes and aims to capture both short-term and long-term trends.
The Know Sure Thing (KST) indicator is named as such because it aims to provide traders with a higher level of confidence or certainty in identifying potential market trends and reversals. The term “Know Sure Thing” reflects the idea that the indicator attempts to cut through market noise and provide a clear signal or indication of market momentum. It combines various moving averages and rate of change calculations to generate a comprehensive view of market conditions.
The KST indicator gained popularity among technical analysts and traders since its inception. It helps to identify potential buying and selling opportunities in stocks, commodities, and other financial instruments. In this dynamic world of trading, traders continue to study and utilize the KST to arrive at conclusions in their trading decisions.
How does Know Sure Thing (KST) work?
The Know Sure Thing (KST) indicator measures the rate of change of a smoothed rate of change of the sum of multiple exponential moving averages (EMAs). The Know Sure Thing indicator is used to analyze market momentum. Different time frames analysis like short-term analysis and long-term analysis is possible by incorporating multiple timeframes and moving averages. The KST indicator highlights periods of accelerating or decelerating momentum, which helps in confirming the strength of the existing trend.
The Know Sure Thing (KST) indicator combines several components and calculations to provide a measure of market momentum and identify potential trend reversals. KST’s working depends on eight major steps.
1. Price Data: The KST indicator utilises the price data especially the closing price from the analysed asset or security.
2. Moving Averages: The KST incorporates four different exponential moving averages (EMAs) with varying timeframes. These moving averages are calculated using the price data obtained in the initial step. The time frame is chosen as per the trader’s preference.
3. Rate of Change (ROC): The KST calculates the rate of change of each of the four EMAs. The ROC measures the percentage change in the moving averages over a specific period.
4. Smoothing: The KST applies a series of additional moving averages to generate a smoother and more responsive KST line.
5. Weighting: Each smoothed rate of change value is assigned a weight based on the selected timeframes. Longer-term moving averages receive higher weights to account for the significance of longer-term trends.
6. Summation: The KST sums up the weighted smoothed rate of change values to arrive at a single KST line.
7. Signal Line: A signal line, often a simple moving average, is applied to the KST line to identify potential crossovers and generate trading signals.
8. Interpretation: Traders analyze the KST line and its relationship with the signal line. It helps in identifying the bullish and bearish signals.
A bullish trend occurs when the KST line crosses above its signal line, it generates a buy signal. The buy signal denotes the bullish trend. A cross below the signal line generates a sell signal, indicating a bearish trend. The KST indicator aims to provide insights into market momentum and help traders make more informed decisions about entering or exiting positions.
How does Know Sure Thing (KST) differ from other Indicators?
The Know Sure Thing (KST) indicator differs from other indicators in five key ways. They are as follows:
1. Multi-Timeframe Analysis: The KST incorporates multiple timeframes by using multiple exponential moving averages (EMAs) with varying lengths. Thus the indicator captures both short-term and long-term trends.
2. Weighting and Summation: The KST assigns weights to the smoothed rate of change values based on the chosen timeframes. Longer-term moving averages receive higher weights. The weighted values are then summed to generate the KST line. This process aims to give more importance to longer-term trends compared to other indicators.
3. Momentum Focus: The KST measures momentum and identifies potential trend reversals. The KST’s primary purpose is to capture and assess market momentum.
4. Double Smoothing: The KST applies double smoothing to the rate of change (ROC) values calculated from the EMAs. It helps reduce noise and creates a smoother KST line, making it easier to identify trends and potential reversals.
5. Crosses and Signals: The KST generates trading signals based on the crossovers between the KST line and a signal line (often a simple moving average). These crosses indicate potential trend changes and provide actionable trading signals.
The unique characteristics of the KST make it a valuable tool for momentum analysis and trend identification, but its effectiveness may vary depending on individual trading strategies and market conditions.
Which is better, KST or MACD?
The KST indicator uses multiple exponential moving averages thus it is a better indicator. Both KST’s and MACD’s significance depends on various factors, including the trader’s preferences, trading style, and the specific market being analyzed. Both indicators have their strengths and can provide valuable insights when used appropriately.
The three key benefits of Know Sure Thing (KST) are as follows :
- The KST is designed to capture market momentum and identify potential trend reversals by combining multiple timeframes and moving averages.
- It provides a comprehensive view of market conditions and aims to give more weight to longer-term trends.
- The KST can be effective in identifying significant turning points and generating trading signals based on crossovers between the KST line and a signal line.
The three key benefits of Moving Average Convergence Divergence (MACD) are as follows :
- The MACD is a popular trend-following indicator that measures the relationship between two moving averages.
- It helps identify the strength, direction, and potential crossovers of a trend.
- The MACD can provide signals when the MACD line crosses above or below the signal line, indicating potential bullish or bearish trends.
The choice between the KST and MACD depends on the trader’s individual needs and preferences. Some traders may prefer the KST for its focus on momentum and multi-timeframe analysis, while others may find the simplicity and trend-following nature of the MACD more suitable. It’s important to test and understand each indicator thoroughly and consider how it aligns with your trading strategy and goals.
How vital is Know Sure Thing (KST) in Technical Analysis?
The Know Sure Thing (KST) indicator can be a valuable tool in technical analysis, providing insights into market momentum and potential trend reversals. Four factors to consider regarding the significance of the KST in technical analysis are as follows:
1. Comprehensive Momentum Analysis: The KST is designed to capture both short-term and long-term market momentum by incorporating multiple timeframes and moving averages.
2. Identifying Potential Reversals: The primary purpose of the KST is to identify potential trend reversals. By analyzing crossovers between the KST line and the signal line, the indicator can generate trading signals that highlight potential turning points.
3. Confirmation with Other Indicators: The KST can be used in conjunction with other technical analysis tools to confirm signals and strengthen trading decisions. Combining the KST with trend-following indicators, oscillators, or price patterns can provide a more robust analysis of market conditions.
4. Individual Trading Style: The significance of the KST in technical analysis also depends on a trader’s trading style and preferences. KST can be used for momentum analysis, trend reversals and as a tool for support and resistance levels or volume analysis.
Technical analysis typically involves a combination of tools, indicators, and analysis techniques to form a comprehensive trading strategy. Traders should consider the strengths and limitations of the KST before taking serious trading decisions.
How to identify Know Sure Thing (KST) in the stock chart?
The Know Sure Thing (KST) indicator on a stock chart identification can be done with the help of popular charting platforms, such as TradingView, ThinkorSwim, MetaTrader, and others, which provide the KST indicator as one of the available technical analysis tools.
Here’s a step-by-step guide to adding and identifying the Know Sure Thing (KST) indicator on a stock chart using TradingView as an example:
1. Access the TradingView website and sign in to your account.
2. Select the Stock you want to analyze.
3. Click on the “Indicators & Strategies” icon (looks like a zigzag line).
4. Search for KST
5. Add KST to the Chart
6. Analyze the KST indicator, it will appear as a line or histogram below the price chart. The KST line represents the calculated value of the indicator, while the histogram represents the difference between the KST line and its signal line.
7. Interpret the KST indicator based on its movements and crossovers with its signal line.
Each charting platform might possess slight changes in the steps followed but most of the platforms follow the above-mentioned steps.
How is Know Sure Thing (KST) calculated?
The calculation of the Know Sure Thing (KST) indicator involves six steps. The general overview of how the KST is calculated is given below:
1. Select the desired timeframes: Determine the periods for EMAs used in the calculation. Typically, four different time frames are selected, representing short-term and long-term periods.
2. Calculate the rate of change (ROC) for each EMA: Compute the percentage change between the current value of each EMA and its value a specified number of periods ago.
3. Apply smoothing to the ROC values: Apply a smoothing mechanism to the rate of change values to reduce noise and create a smoother KST line.
4. Apply weights to the smoothed ROC values: Assign weights to the smoothed ROC values based on the selected timeframes.
5. Sum the weighted smoothed ROC values: Sum up the weighted smoothed ROC values to obtain a single value. The summation represents the KST line.
6. Apply a signal line: A signal line is applied to the KST line. It helps identify crossovers and generate trading signals.
The formula for calculating the Know Sure Thing (KST) indicator is explained below:
1. Calculate the Rate of Change (ROC) for each of the four moving averages:
ROC1 = [(Close – Close n periods ago) / Close n periods ago] * 100
ROC2 = [(Close – Close m periods ago) / Close m periods ago] * 100
ROC3 = [(Close – Close p periods ago) / Close p periods ago] * 100
ROC4 = [(Close – Close q periods ago) / Close q periods ago] * 100
Close represents the closing price of the asset at the current period, and n, m, p, and q represent the lengths (in periods) of the four moving averages used in the calculation.
2. Apply exponential moving averages (EMAs) to the calculated ROC values:
EMA1 = EMA(ROC1, x)
EMA2 = EMA(ROC2, y)
EMA3 = EMA(ROC3, z)
EMA4 = EMA(ROC4, w)
EMA is the exponential moving average function, and x, y, z, and w represent the smoothing factors applied to each ROC value.
3. Calculate the KST line:
KST = EMA1 + 2 * EMA2 + 3 * EMA3 + 4 * EMA4
The KST line is the sum of the weighted EMAs of the ROC values. It represents the final value of the KST indicator.
The specific formula and parameters used in the KST calculation may vary slightly depending on the platform or software being used. Traders can adjust the timeframes, smoothing periods, and other parameters to suit their preferences and trading strategies.
How to use Know Sure Thing (KST) in Trading?
The Know Sure Thing (KST) is a technical indicator used in trading to identify potential trend reversals and generate trading signals. It is a momentum oscillator that combines multiple moving averages to provide a smoothed measurement of price momentum. The following seven steps explain the way to use the KST indicator:
1. Obtain the KST indicator: The KST indicator is calculated by using the general formula: KST = EMA1 + 2 * EMA2 + 3 * EMA3 + 4 * EMA4
2. Understand the components: The KST indicator consists of four different moving averages with varying lengths and smoothing factors. These moving averages are typically exponential moving averages (EMA). The four components are plotted on a chart and combined to generate the KST line.
3. Interpret the KST line: The KST line can be interpreted in a similar way to other oscillators. It moves above and below a centre line or zero line, indicating bullish or bearish momentum, respectively. Crossovers and divergences can be used as potential trading signals.
4. Identify crossovers: The KST line crossing above the centre line or zero line, indicates a bullish signal, suggesting a potential uptrend. The KST line crossing below the center line or zero line, denotes a bearish signal, suggesting a potential downtrend.
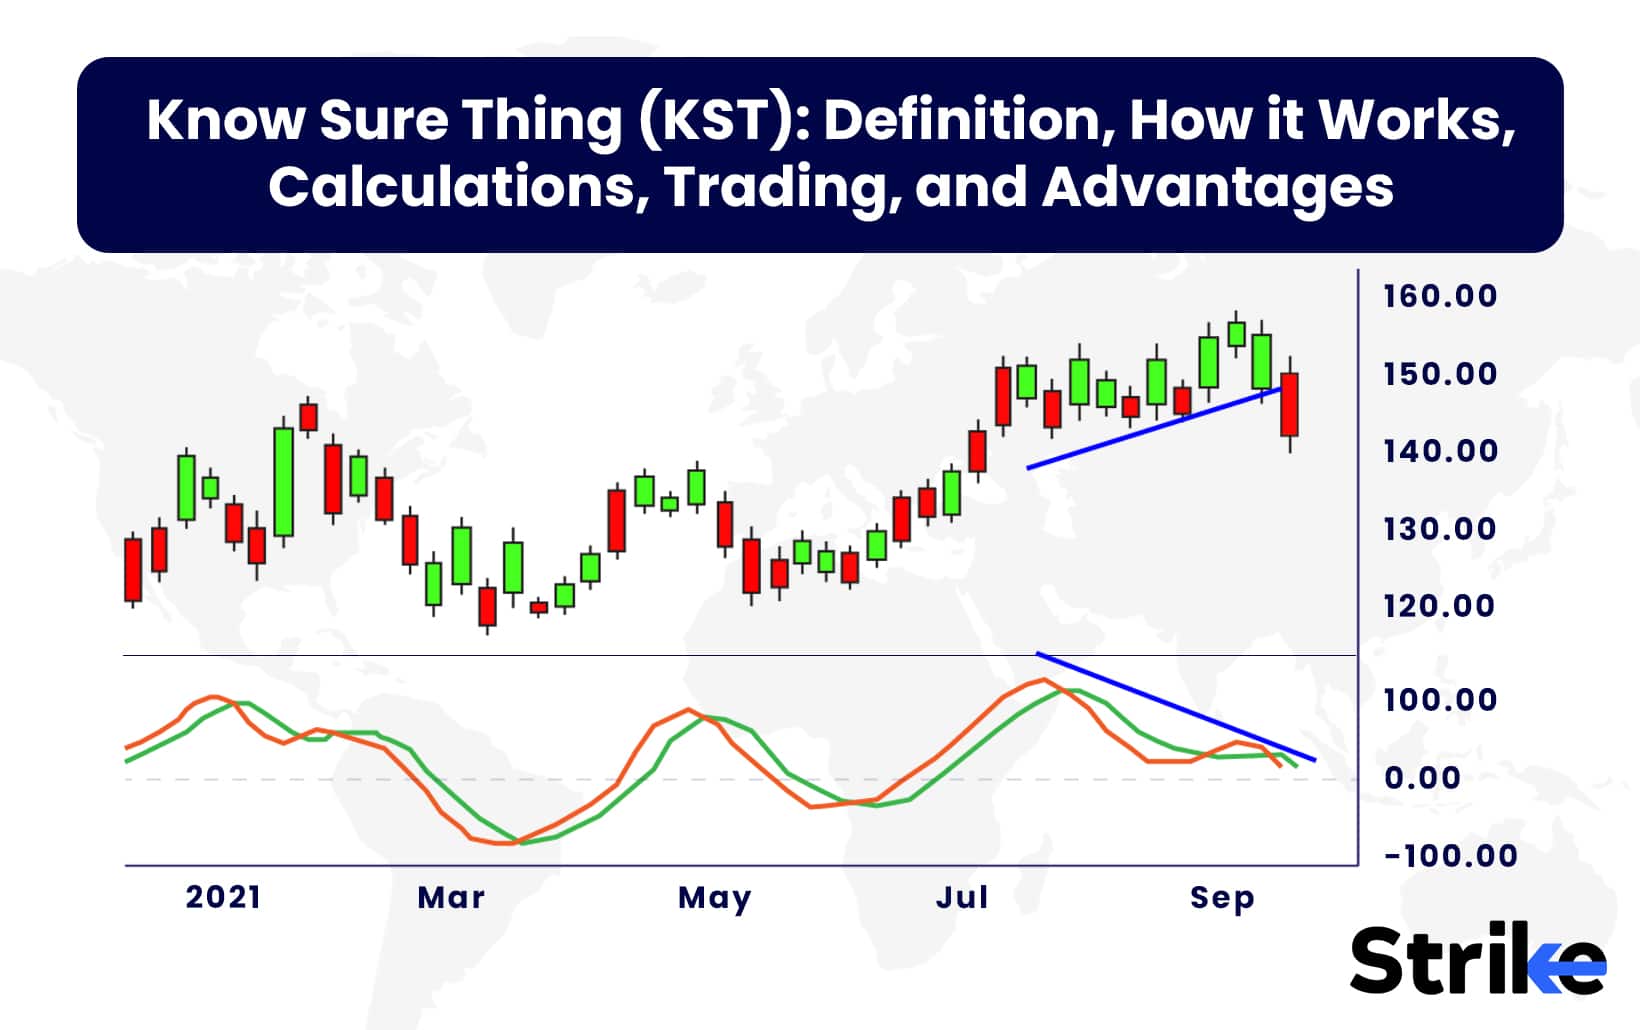
5. Look for divergences: Divergences occur when the price of an asset moves in one direction while the KST indicator moves in the opposite direction. Bullish divergence happens when the price makes lower lows while the KST indicator makes higher lows. A bearish divergence occurs when the price makes higher highs while the KST indicator makes lower highs. Divergences can signal potential trend reversals.
6. Confirm signals with other indicators: The KST indicator is used in conjunction with other technical indicators and analysis tools to confirm trading signals.
7. Practice and refine your strategy: It’s crucial to practice using the KST indicator and refine your strategy over time. Test it on historical data or in a demo trading environment to gain confidence and assess its effectiveness in your trading approach.
Every indicator has its pros and cons thus it is advised to use the KST indicator in conjunction with other technical indicators and the analysis must be done in multiple ways to ensure the best results.
What trading strategies are best for Know Sure Thing (KST)?
The Know Sure Thing (KST) indicator can be used in various trading strategies, depending on the trader’s trading style and preferences. Four most common strategies that traders employ when utilizing the KST:
1. Trend Reversal Strategy: The KST can be effective in identifying potential trend reversals. The KST line crossing above the centre line or zero line generates a bullish signal and indicates a potential uptrend. The KST line crossing below the center line or zero line, generates a bearish signal, suggesting a potential downtrend.
2. Confirmation Strategy: The KST can be used to confirm signals generated by other technical indicators. The KST generating a bullish signal is a confirmation to enter into a long trade. A bearish signal is a confirmation to enter a short trade.
3. Divergence Strategy: Divergences between the price and the KST indicator can provide valuable trading signals. A bullish divergence occurs when the price makes lower lows while the KST indicator makes higher lows. This represents an upward momentum shift, indicating a potential buying opportunity. Bearish divergence occurs when the price makes higher highs while the KST indicator makes lower highs. This represents a potential downward reversal and a potential selling opportunity.
4. Overbought/Oversold Strategy: The KST can also be used to identify overbought and oversold conditions in the market. When the KST line reaches extreme levels (either extremely high or extremely low), it suggests that the price may be due for a reversal.
The KST indicator combines with other analysis tools, such as support and resistance levels, trendlines, and volume analysis, to increase the accuracy of trading decisions. Risk management and money management should always be considered when implementing any trading strategy.
When is the best time to use Know Sure Thing (KST)?
The Know Sure Thing (KST) indicator can be used on various timeframes, depending on your trading objectives and preferences. The choice of the timeframe will determine the duration of trades and the frequency of signals generated by the indicator. Here are a few considerations for selecting the appropriate time to use the KST:
1. Intraday Trading: Short-term traders focusing on intraday trading can apply KST on lower timeframes (5-minute, 15-minute, or 1-hour charts). This helps in capturing quick momentum shifts and taking advantage of short-term trends. In intraday trading, it’s essential to monitor the indicator frequently and make prompt trading decisions based on the signals generated.
2. Swing Trading: Swing traders typically aim to capture medium-term trends and reversals. In swing trading, the timeframes are mostly higher time frames such as daily, weekly, or even monthly.
3. Long-Term Investing: The KST is not commonly used for long-term investing, but it can still offer insights into the overall momentum of a market or asset.
Some assets may exhibit stronger trends and clearer signals, making the KST more effective. It’s always advisable to conduct thorough testing and analysis to determine the optimal timeframe and market for using the KST in your trading strategy.
Short term Know Sure Thing indicator is used in the below-mentioned case:
The term “short KST” is not commonly used in the context of the Know Sure Thing (KST) indicator. The KST is typically calculated using longer-term moving averages to provide a smoothed measurement of price momentum. A short KST may be more suitable for shorter timeframes, such as intraday or short-term trading. It can help identify quicker momentum shifts and potential trading opportunities within a shorter time horizon.
Short KST indicators might be beneficial in highly volatile markets where price movements are more rapid. The shorter-term calculation can adapt more quickly to changing market conditions, allowing traders to capture short bursts of momentum during volatile periods. Scalpers aim to profit from small price movements in a short period. If you are employing a scalping strategy, a short KST may assist in identifying brief bursts of momentum or short-term reversals that can be capitalized on for quick trades.
Long term Know Sure Thing indicator is used in the below-mentioned case:
The long-term KST indicator is a modified variation of the Know Sure Thing (KST) indicator. A long KST is typically applied to longer timeframes, such as daily, weekly, or monthly charts. It can help identify broader and more sustainable trends in the market. This is particularly relevant for swing traders or long-term investors who seek to capture larger price movements and stay in positions for extended periods. The long KST can be effective for trend identification and confirmation. Long-term KST is useful in the case of position trading, which involves holding trades for several weeks to months. It assists in capturing major trend reversals and staying aligned with the prevailing market direction.
It’s important to note that the specific parameters and interpretation of a short KST as well as a long KST may vary depending on the modifications made to the original indicator. It’s recommended to thoroughly understand the methodology and backtest the indicator on historical data to assess its effectiveness before using it in live trading. Additionally, risk management, money management, and keeping an eye on market conditions and fundamental developments remain crucial components of a comprehensive trading approach.
Is Know Sure Thing (KST) a good indicator for Options Trading?
Yes. The Know Sure Thing (KST) indicator is considered a momentum oscillator designed to identify trend changes and potential entry/exit points in the market. It uses multiple timeframes for analysis hence providing precise results when compared to other indicators.
The KST indicator can help analyze price trends and momentum; still, there is no single indicator that guarantees success in option trading or any other form of trading. Hence, a combination of indicators must be used before arriving at a decision. The market conditions must be properly understood before taking any option trading decision.
What are the advantages of Know Sure Thing (KST)?
The Know Sure Thing (KST) indicator offers six advantages to traders and investors. It includes smoothed momentum measurement, trend reversal identification, divergence detection etc :
1. Smoothed Momentum Measurement: The KST provides a smoothed measurement of price momentum by combining multiple moving averages. Smoothing helps in reducing noise and helps filter out short-term fluctuations. This in turn helps in making it easier to identify the underlying trend and significant momentum shifts.
2. Trend Reversal Identification: The KST is useful for identifying potential trend reversals. The shift in the market sentiments and the potential trend changes can be identified by monitoring the crossovers above or below the zero line.
3. Divergence Detection: The KST effectively detects divergences between the indicator and price movements. It also helps in understanding the potential trend reversals and receive insights on the bullish and bearish signals.
4. Versatility in Timeframe Usage: The KST can be applied to various timeframes, allowing traders and investors to adapt it to their preferred trading styles. KST offers both short-term and long-term analysis which is purely based on the timeframe taken into consideration.
5. Confirmation Tool: Almost all the technical indicators are used in conjunction with other technical indicators for best results. The KST is used in conjunction with other technical analysis tools to confirm trading signals. By combining the KST with other indicators traders can increase the probability of successful trades.
6. Customization Options: While the KST has a standard formula, traders have the flexibility to customize the indicator based on their preferences. This includes adjusting the moving average lengths, smoothing factors, and other parameters to align with their trading strategies and desired sensitivity to price changes.
The KST is not infallible and should be used in conjunction with other analysis methods. Risk management, money management, and overall market analysis should always be considered before taking any trading decisions.
What are the disadvantages of “Know Sure Thing” (KST)?
The Know Sure Thing indicator offers six advantages that help in the proper understanding of market conditions. There are five major disadvantages of the KST indicator. They are as follows:
1. Lagging Indicator: The KST is a lagging indicator like most technical indicators. This means that it relies on past price data to generate signals and can result in delayed responses to rapid price changes or quick market reversals.
2. Subject to False Signals: No trading indicator is immune to false signals, and the KST is no exception. It can generate false buy or sell signals, leading to potential losses if relied upon solely.
3. Sensitivity to Parameter Settings: The KST indicator requires setting specific parameters, such as the lengths of moving averages and smoothing factors. Different parameter settings can yield varying results and signals. The parameters should be chosen as per the trader’s needs for smooth functioning and better results.
4. Complex Calculation: The KST indicator involves multiple moving averages and calculations, making it more complex compared to simpler indicators. This can affect the ease of understanding the indicator outputs.
5. Market Dependence: The effectiveness of the KST may differ across different markets, timeframes, or assets, as each has its own unique characteristics.
It’s important to remember that no single indicator can guarantee accurate and profitable trading decisions. The KST should be used as part of a comprehensive trading strategy, alongside proper risk management, money management, and consideration of other relevant market factors.
Is Know Sure Thing (KST) a profitable indicator?
No. KST cannot be considered a highly profitable indicator. Every indicator’s profitability depends on certain conditions which include the proper market analysis, timeframes used, assent being traded etc. Thus the profitability of the Know Sure Thing (KST) indicator, or any other trading indicator, is not guaranteed.
The KST can provide valuable insights into price momentum and potential trend reversals, but it is essential to understand its limitations and consider it as part of a comprehensive trading strategy. Successful trading involves more than just relying on a single indicator. Backtesting the indicator on historical data can provide insights into its performance in different market conditions.
Can long-term investors use the KST Indicator?
Yes, long-term investors can certainly use the Know Sure Thing (KST) indicator as part of their analysis and decision-making process. While the KST is often associated with shorter-term trading and identifying potential trend reversals, its principles can still be applied to long-term investing strategies.
Long-term investors can make use of the KST indicator in the following four ways :
1. Trend Confirmation: Long-term investors typically aim to capture the broader trend of an asset. The KST can be used to confirm the prevailing trend and validate the investor’s analysis. It also helps in understanding whether it is a bullish momentum or a bearish momentum.
2. Entry and Exit Points: The KST can help identify potential entry points during periods of positive momentum and potential exit points when momentum starts to weaken.
3. Rebalancing and Portfolio Management: Long-term investors often rebalance their portfolios periodically to maintain desired asset allocations. The KST assists in assessing the momentum and relative strength of different asset classes or sectors. The KST indicator also helps the investors determine the allocation of more capital to stronger momentum areas to balance the shifts in the market trends.
4. Risk Management: The KST indicator can be used as a risk management tool. Investors can identify potential shifts in market sentiment or underlying trends that could affect their investment thesis.
It’s important for long-term investors to consider the KST as one of many tools in their analysis toolkit and to combine it with fundamental analysis, market research, and other indicators to make well-informed investment decisions. The KST indicator provides a much wider perspective of the market sentiments.
Indicators are tools used by traders and investors to analyze price trends, market sentiment, and potential entry or exit points for trades. Similar is the case with the Know Sure Thing indicator which is also known as the KST indicator. This price momentum indicator helps in understanding the market trends with the help of multiple exponential moving averages. These indicators offer tremendous advantages also with a couple of disadvantages. KST can be used as a short-term indicator and with slight modifications can be used as a long term indicator in the stock market trend analysis.


 Previous Article


: Meaning, 5 Types, Trading Strategy with Example, Win Rate 3")
 2026: Features, Pros vs Cons, Pricing, Reviews, Is It Worth It? 4")
 2026: Features, Pros vs Cons, Pricing, Reviews, Is It Worth It? 5")
 2026: Features, Pros vs Cons, Pricing, Reviews, Is It Worth It? 6")


 : Definition, Formula, calculation, Uses, Advantages Vs limitations 10")


No Comments Yet.