Hidden Divergence: Definition, Types, Identification, Example, Trading Guide
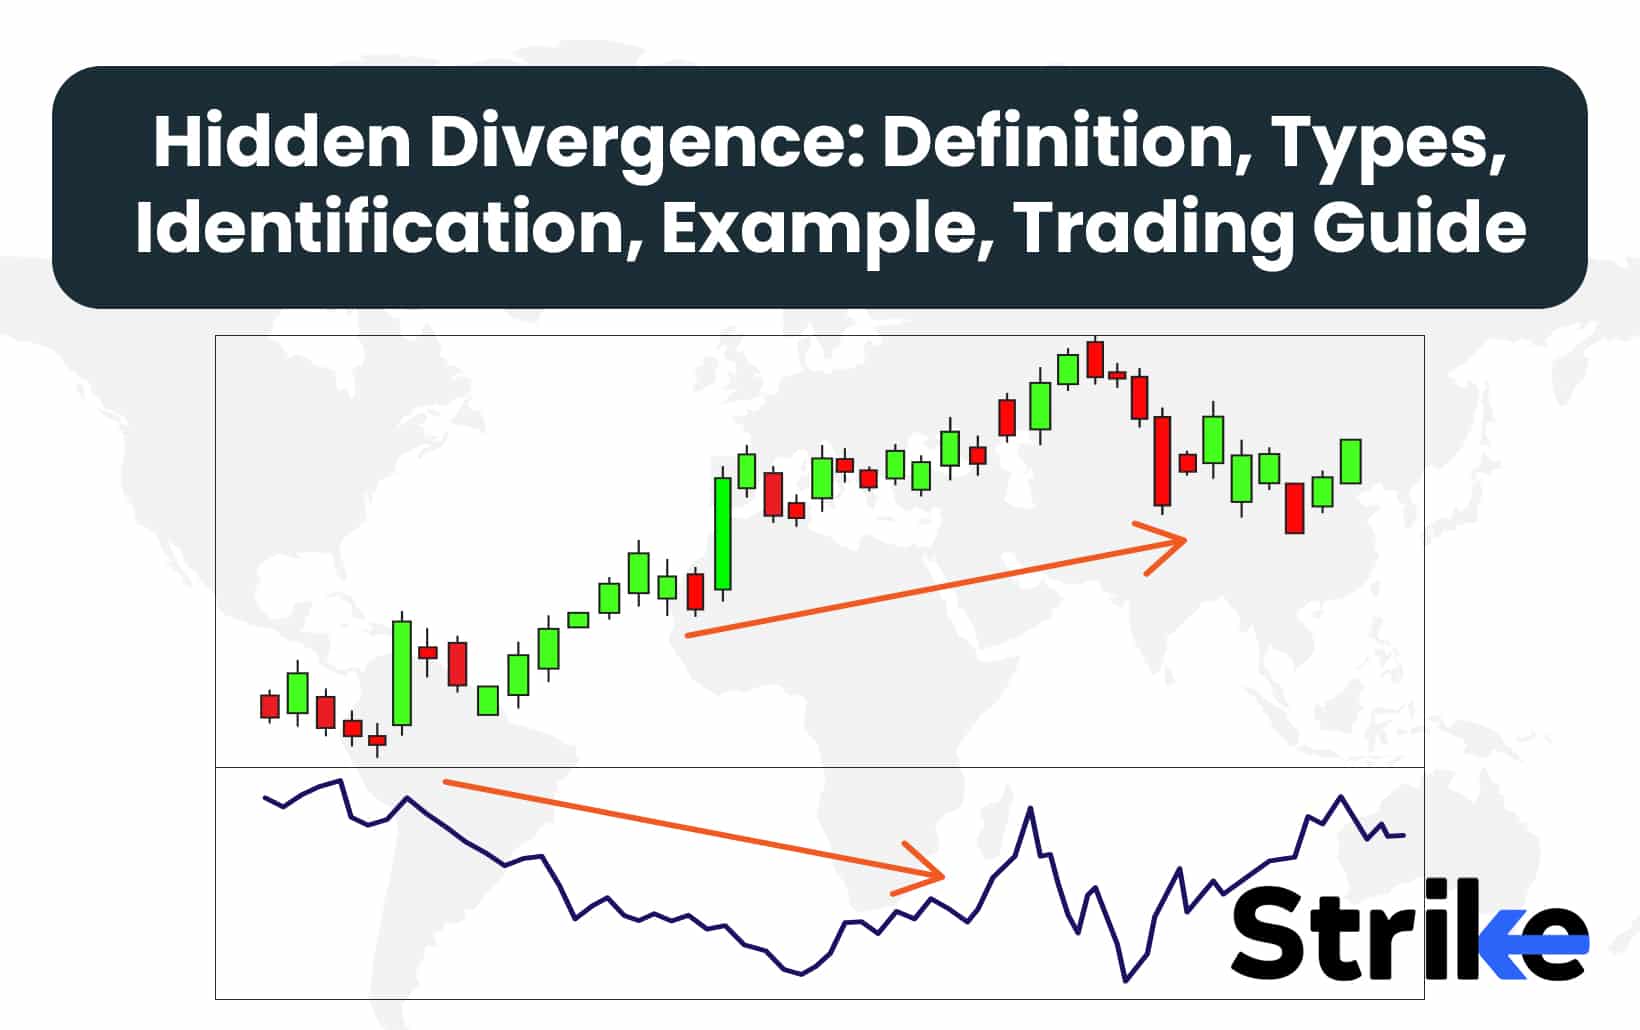


Hidden divergence is a technical analysis concept where the price of an asset moves in one direction while an oscillator or momentum indicator moves in the opposite direction, suggesting a potential continuation of the prevailing trend.
Hidden divergence is comparable to regular divergence, in which the price of an asset and an indicator fluctuate in contrary directions. However, while regular divergence provides an early warning of a potential reversal or shift in price direction, hidden divergence informs you in advance when a trend is expected to persist.
What Is A Hidden Divergence?
Hidden divergence is a form of technical analysis that is used to identify the potential for trend continuation or trend reversal in financial markets. Hidden divergence entails the comparison of price action with an oscillator, such as the Stochastic Oscillator, Moving Average Convergence Divergence (MACD), or Relative Strength Index (RSI).
What Is The Difference Between Regular vs Hidden Divergence?
The main difference between regular and hidden divergence is that hidden divergence signals the continuation of the trend, while regular divergence signals trend reversals. Regular divergences and predicted and spotted easily than hidden divergence as well.

Take a look at the above chart. Here, you will be able to see a trend reversal, from negative to positive, following a regular divergence. But for the hidden divergence , the trend continues.
Why Should You Understand Hidden Divergence?
You should understand hidden divergence because it indicates a continuation of the existing trend rather than a reversal. Understanding hidden divergence gives traders an edge by allowing them to enter trades in the direction of the prevailing trend with a higher probability of success. Hidden divergence is also used across various timeframes and markets, making it a versatile tool for both short-term and long-term trading strategies.
What Are The Types Of Hidden Divergence?
The two types of hidden divergences are bullish and bearish divergences. Below is more details about both with a graphical representation.
1. Bullish Hidden Divergence
Bullish hidden divergence takes place within a downtrend, indicating a potential reversal or a weakening of the downward momentum. The price’s lower low in this case denotes a new low that surpasses the previous one. The oscillator, such as the RSI or MACD, concurrently forms a higher low. Despite the ongoing downtrend, this discrepancy between the oscillator and price action indicates that the underlying momentum is changing. The bears are losing strength, and traders interpret this as a sign that a bullish reversal or a continuation of the trend to the upside may be imminent. This signals them to place long orders. Below is a chart representing the same.

2. Bearish Hidden Divergence
A bearish hidden divergence is detected within an upward trend, suggesting that the upward momentum may be diminishing or reversing. This results in a price that surpasses the preceding peak, forming a higher high. Concurrently, the oscillator, such as the MACD or RSI, establishes a lower high. Despite the fact that the price is reaching new highs, this discrepancy indicates that the underlying momentum of the uptrend is waning.
Traders interpret bearish hidden divergence as a cautionary signal, indicating that the bulls may be losing ground and that a bearish reversal or continuation of the downtrend may be imminent. It serves as a warning for traders who are involved in long positions and is a prompt to consider potential exits, short trades, or adjustments to their trading strategy. Below is a chart representing the hidden divergence.

These subtle signals, when correctly interpreted, provide valuable insights into underlying market momentum and help traders make more informed decisions about entry and exit points, risk management, and overall trading strategy.
How to Identify Hidden Divergence?
There three primary ways to identify hidden divergence. This is done using RSI, MACD, and stochastic oscillator. Below is how.
1. Using RSI
Look at the below chart to understand how to identify hidden divergence using RSI.

Here, the trend structure maintained its integrity, despite the increasing adverse momentum indicated by the RSI. The hidden divergence therefore provides an opportunity to participate in the bull trend at a reduced cost. The hidden divergence would have been rendered invalid if the market had declined below the “A” swing pivot. In that event, momentum and price have converged. That means, lower lows on both the price and RSI plots.
2. Using MACD
Using MACD, you will be able to identify hidden divergence, as shown below.

The rising candlesticks and the arrow pointing upwards on the chart demonstrate a clear upward trend in the price action. Bullish hidden divergence is highlighted in the image. While the price makes a higher low, the MACD histogram (shown at the bottom) makes a lower low. This divergence between price and indicator suggests underlying bullish momentum despite the brief price dip.
Following the hidden divergence, there’s a large green candlestick marked as an “outside bar” or “reversal bar.”. This indicates a strong bullish move that confirms the hidden divergence signal.
The MACD histogram at the bottom of the chart is crucial for identifying this hidden divergence. The bars become more negative (moving further below the zero line) even as the price makes a higher low, creating the divergence.
3. Using Stochastic Oscillator
To identify hidden divergence using the Stochastic Oscillator, as shown in the image, you need to closely observe both the price action and the oscillator movements.

In a downtrend like we see in this S&P 500 E-mini Futures chart, look for lower highs in price while checking if the Stochastic (the blue and orange lines at the bottom) makes higher highs – this would indicate bearish hidden divergence. Conversely, in an uptrend, search for higher lows in price paired with lower lows in the Stochastic for bullish hidden divergence.
The clearest example in this chart might be around the 22nd-23rd, where there’s a slight higher low in price but a lower low in the Stochastic, potentially signaling bearish hidden divergence. It’s crucial to confirm these signals by looking for the Stochastic lines crossing or reaching overbought (above 80) or oversold (below 20) levels.
Learning to identify hidden divergence using various indicators such as RSI, MACD, and Stochastic Oscillator help traders enhance their ability to spot high-probability trading opportunities and make more informed decisions in the market.
What Is An Example Of Hidden Divergence?
Below is an example of hidden divergence.

This chart of HDFC Bank demonstrates a classic example of bearish hidden divergence. The price action shows a higher high between late March and mid-April 2020, as indicated by the upward-sloping red line on the price chart.
However, the RSI (Relative Strength Index) at the bottom of the chart forms a lower high during the same period, shown by the downward-sloping red line on the RSI. This divergence between price and momentum indicator suggests that while the price is making new highs, the underlying buying pressure is actually weakening. It’s a subtle signal that the upward price movement may not be sustainable.
The chart also highlights a critical support level with a blue line. The annotation suggests that if the price breaks below this level, it could accelerate the bearish trend.
How To Trade Hidden Divergence?
Let us take look at how to trade hidden divergence using our example.

First, identify the bearish hidden divergence: notice the price making a higher high while the RSI forms a lower high, as indicated by the red lines on both the price chart and RSI. This pattern suggests weakening bullish momentum despite the price increase. The overall downward trend prior to the divergence reinforces the bearish outlook, as hidden divergence often signals trend continuation.
Wait for confirmation before entering a trade; in this case, watch for a break below the blue uptrend line marked on the chart. The annotation “If price breaks below these level more bearish” provides a potential trigger point for entering a short position. Set a stop loss above the recent high where the divergence formed, and consider the support level at 733.50 as an initial price target.
Manage your risk by ensuring your potential loss is smaller than your potential gain, and possibly use a trailing stop to protect profits. Throughout the trade, monitor the RSI for any signs of bullish momentum returning, using technical analysis to guide your decisions. Be prepared to exit if the price action contradicts your bearish thesis. Employ technical analysis to interpret market signals accurately and make informed trading choices.
What Are The Limitations of Hidden Divergence?
Below are five limitations of hidden divergence.
- Not all hidden divergences lead to significant price movements. Markets is unpredictable, and other factors may override the divergence signal, leading to false or weak trends.
- Identifying hidden divergence Is subjective, especially in choppy or sideways markets. Different traders may interpret the same chart differently, leading to inconsistent results.
- Hidden divergences may appear differently or not at all across various timeframes. What looks like a clear divergence on a daily chart might not be evident on an hourly or weekly chart.
- Hidden divergence tends to be more reliable in trending markets. In ranging or highly volatile markets, its effectiveness sometimes diminishes.
- Trading solely based on hidden divergence without confirmation from other technical indicators or price action is risky.
Apart from this, during very strong trends, hidden divergence signals may be less frequent or reliable, as the momentum can overpower the indicator’s signals


Share


No Comments Yet