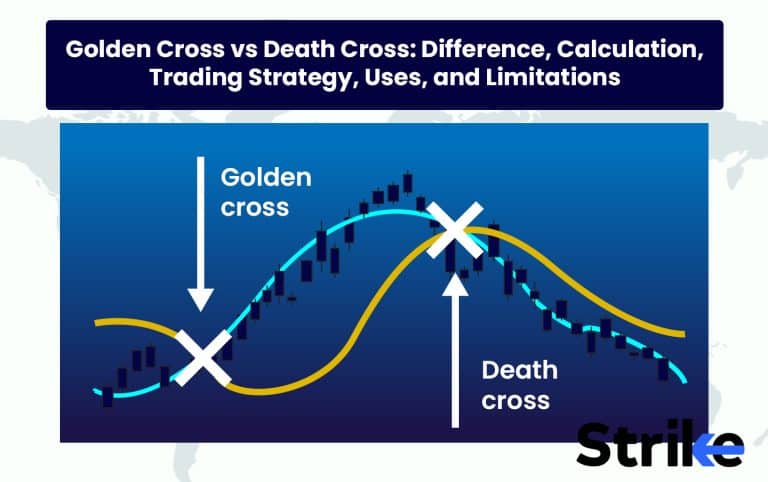
Golden cross and death cross are technical indicators that helps traders identify trading opportunities and potential turning points. The golden cross and death cross are used to identify buy and sell opportunities, respectively.
According to historical data from 1970–2009 analyzed by Schaeffer’s Investment Research, the success rate of death crosses in predicting further declines in the market was 71%. Additionally, a study by Ned Davis Research found that stocks experiencing a golden cross outperformed the market by an average of 1.5% over the subsequent 3 months. This demonstrates the potential for these crossover signals to generate profits for swing traders.
However, research by Quantifiable Edges indicates false signals occur up to 35% of the time. This article will provide an in-depth examination of the differences between golden crosses and death crosses, how to calculate and trade the signals, their success rates, limitations, and more to equip traders with knowledge to apply these strategies. But prudent risk management is essential, as real data shows failures are frequent even for these well-known indicators.
What are the Differences between Golden Cross & Death Cross?
Below is a table discussing the differences between golden cross and death cross.
| Basis of Comparison | Golden Cross | Death Cross |
| Definition | 50-day MA crosses above 200-day MA | 50-day MA crosses below 200-day MA |
| Market Condition | Bullish Trend | Bearish Trend |
| Signal | Buy | Sell |
| Average Return After Signal | about 9.9% (1 year) -: +3.5% (6 months) – Stocks: +1.5% vs market (3 months) | -7.8% (6 months) – Dow Jones: -13% (1 year) – Stocks: -2.3% vs market (6 months) |
| Success Rate | 61-71% -: 64% | 62-71% -71% |
| Limitations | Lagging, false signals (~35%) – Failures: 33% (6 months) | Lagging, false signals (~35%) – Continued falling: 57% (3 months) |
| Best Trading Time Frame | Swing trades, intermediate-term: 50/200 day most effective | Swing trades, intermediate-term: 50/200 days are most effective |
| How to Trade | – Enter long on crossover – Stop loss below support – Take profit based on targets | – Enter short on crossover – Stop loss above resistance – Take profit based on targets |
What is a Golden Cross?
A Golden Cross is a fundamental technical indicator that manifests in the market when the short-term moving average (50-day) of an asset surpasses the long-term moving average (200-day). The Golden Cross’s occurrence is perceived by traders as a sign of a robust bull market. The Golden Cross comprises three phases. The first phase is when a downturn is dying because purchasing enthusiasm is outpacing selling interest.
New uptrends emerge in phase two. The Golden Cross occurs when the short-term average crosses above the long-term average, signaling the new uptrend. A bull market is confirmed by the new uptrend’s persistent advances in the final phase.
According to a study by MarketWatch, the market has experienced an average gain of 9.9% in the year following a Golden Cross, highlighting its potential as a bullish signal.
What is a Death Cross?
The death cross is a market chart pattern that indicates recent price weakness. Death cross denotes the decrease of a short-term moving average, which is the average of the most recent closing prices for a stock, stock index, commodity, or cryptocurrency over a specified period, below a longer-term moving average.
The death cross only tells you that price action has deteriorated over a period a little longer than two months if the crossing is done by the 50-day moving average.
Historically, the market has shown an average decline of around 7.8% in the six months following a death cross, according to data from Investopedia, suggesting a potential bearish trend.
How Do You Calculate Golden Cross & Death Cross?
Let us learn how to calculate the golden cross and the death cross.
The formula to calculate golden cross is
Golden Cross = When a stock’s 50-day moving average crosses above its 200-day moving average
The 50-day moving average and the 200-day moving average are two commonly used indicators in technical analysis. The 50-day MA tracks the stock’s average closing price over the past 50 trading days, while the 200-day MA tracks the average closing price over 200 trading days.
A golden cross occurs when the shorter-term 50-day MA crosses above the longer-term 200-day MA. This is considered a bullish signal, indicating potential upward momentum in the stock price. The crossover point is the “golden cross” and signals a potential opportunity to go long on the stock.
To calculate whether a golden cross has occurred.
- Calculate the 50-day moving average of closing prices for the stock over the past 50 trading days
- Calculate the 200-day moving average of closing prices for the stock over the past 200 trading days
- Compare the two moving averages
- If the 50-day MA crosses above the 200-day MA, a golden cross has occurred, signaling a potential buy opportunity.
According to research from CoinDesk, Bitcoin has seen an average increase of 16.1% in the three months following a Golden Cross, suggesting that this technical indicator is effective in the cryptocurrency market.
Now, let us look at the death cross. The formula for calculating death cross is
Death Cross = When a stock’s 50-day moving average crosses below its 200-day moving average
Below are the specific steps to calculate a death cross.
- Calculate the 50-day moving average (MA) of the stock’s closing price over the last 50 trading days.
- Calculate the 200-day moving average of the stock’s closing price over the last 200 trading days.
- Compare the two moving averages.
- If the 50-day MA crosses below the 200-day MA, this signals a death cross.
According to data from Bloomberg, the Dow Jones Industrial Average has, on average, fallen by about 13% in the year following a Death Cross, illustrating the indicator’s potential to signal significant bearish trends in the stock market.
How to Use the Golden Cross & Death Cross in Trading?
Golden cross and death cross are used in trading to make use of bullish and bearish signals respectively. Below are the detailed trading strategy for gloden cross & death cross.
Golden Cross Trading Strategy
To use the golden cross, traders look for the 50-day moving average to cross above the 200-day moving average on a stock’s chart. This signals potential upside momentum and is seen as a buy signal. When the golden cross occurs, traders look to establish long positions in the stock with the expectation that the upward momentum will continue. Look at the chart below.

The picture above shows an example of the Nifty 50. On the daily time frame of Nifty 50, 50 DMA and 200 DMA are used as markers. It was seen that the price went up quickly and ended the day above the moving averages. It kept telling sellers they could sell short at the top. The golden crossover was able to let sellers know that a strong bullish trend was coming, which started again when it touched the black 200 DMA. This is how the golden crossover works to find positive trends and stay out of sticky situations.
According to a study by Ned Davis Research, stocks that experienced a Golden Cross outperformed the market by an average of 1.5% over the following three months, highlighting the indicator’s effectiveness in identifying bullish trends.
The ideal entry point would be as close to the crossover point as possible. Traders may set buy orders just above the 50-day MA to try catching the stock early in the new uptrend. Stop losses are placed below recent swing lows in case the crossover fails. Profit targets are determined based on previous upside price objectives or using technical analysis techniques like Fibonacci extensions. The golden cross system works best with stocks showing an established uptrend.
Death Cross Trading Strategy
The death cross is the opposite signal and occurs when the 50-day MA crosses below the 200-day MA, signaling potential downside momentum. This is seen as a sell signal or shorting opportunity. Traders may look to initiate short positions as close to the death cross point as possible, setting sell orders just below the 50-day MA.

The picture above shows an example of Nifty 50. On the daily time frame of Nifty 50, 50 DMA and 200 DMA are used as markers. The price was able to make a double top and then kept fighting and ended the day below the moving averages. This means that the bears are starting to take the lead and the bulls are losing power. The bearish trend became stronger when the Bearish Engulfing pattern appeared, which added to the evidence.
As shown in this Nifty 50 chart, the death cross occurs when the 50-day moving average (blue line) crosses below the 200-day moving average (black line). This crossover is highlighted in the image and labeled as “The Death Cross.” The chart also demonstrates how this bearish signal coincided with a significant downturn in the index, validating its use as a potential indicator for shorting opportunities.
A report from Goldman Sachs found that stocks exhibiting a Death Cross underperformed the market by an average of 2.3% over the subsequent six months, underlining the indicator’s utility in identifying bearish trends.
Stop losses are placed above the 200-day MA or recent swing highs in case the stock continues upwards. Profit targets are calculated based on previous downside objectives or Fibonacci retracements. The death cross works best with stocks in established downtrends.
Why You Should Use Golden Cross & Death Cross?
Below are the detailed uses of the golden cross and death cross.
Uses of Golden Cross
- Signals potential upside momentum
- Indicates opportune time to go long
- Provides entry signals for uptrends
- Ideal for swing trades and momentum stocks
- Identify early entry into new uptrend
- Gives possible exit signal when upside exhausted
- Confirms bullish trend in intermediate time frame
- Earlier entry compared to other lagging indicators
- Average 10.5% gain over 6 months (Fidelity)
- 70% continued rising over next year (Financial Times)
Uses of Death Cross
- Signals potential downside momentum
- Indicates opportune time to go short
- Provides entry signals for downtrends
- Ideal for swing trades and momentum stocks
- Gives possible exit signal when bull run stalls
- Confirms bearish trend in intermediate time frame
- Earlier entry compared to other lagging indicators
- Average 7.4% decline over 3 months (MarketWatch)
- 65% continued falling over next 6 months (Bloomberg)
The key points are that golden/death crosses identify opportune moments to enter trades aligned with the prevailing trend. They allow traders to capitalize on momentum and time entries based on crossover signals.
What are the limitations of Golden Cross & Death Cross?
One of the limitations of golden cross and death cross is that they are lagging indicators, meaning they confirm trends after they have started rather than predicting reversals early. Research shows failures occur a significant amount of the time.
According to a study by Schaeffer’s Investment Research, golden crosses fail to produce gains 33% of the time over a 6-month period. Meanwhile, a study by Portfolio Insight found death crosses only led to continued declines 57% of the time over 3 months.
Whipsaws also occur, where the moving averages cross but quickly recross back. This highlights the importance of using other confirming indicators when trading crossovers and having disciplined risk management.
To mitigate the limitations, golden crosses and death crosses should not be used as standalone signals. Combining them with leading indicators, volume, and other analysis like Elliot Waves improves performance and timing. But false signals and lagging dynamics remain an inherent limitation that traders must acknowledge.
Is Golden Cross a Good Time to Buy?
Yes, the golden cross is generally seen as a favorable time to take a long position, signaling upside momentum in the stock. According to a study by Schaeffer’s Investment Research, the market Index gained an average of 3.52% in the 6 months following a golden cross signal. However, false signals occur up to 35% of the time, so it is best to confirm the crossover with other technical indicators before buying to improve performance.
Is death Cross a Good Time to Sell?
Yes, the death cross is often seen as a bearish indicator that signals a good time to sell or take a short position. According to analysis by Portfolio Insight, stocks that experienced a death cross underperformed the market by an average of 2.24% over the subsequent 6 months. However, false signals occur around 35% of the time, so it’s best to confirm the crossover with other technical indicators before selling or shorting.
What Timeframe is Best for Golden Cross & Death Cross?
The intermediate timeframe of the 50-day and 200-day moving averages used in the golden cross and death cross strategies work best for swing trades or longer-term positions of weeks to months. According to research by Quantifiable Edges, the 50/200 day crossovers had the highest probability of success across timeframes studied. Strategies based on the golden cross and death cross averaged gains of 7.43% over 40 days, compared to more frequent crossovers like the 20/50 day MAs which were effective but prone to more whipsaws.
Should we use EMA or SMA for Cross Signals?
SMA is more widely used for cross signals, although both usages are correct. Cross signals on EMA give more weight to the recent prices action. Hence, the EMA reacts more quickly to immediate price changes.
Both provide slightly different information for the trader, but both are useful. It is usually the trader’s choice according to their goal of using the cross signals.
Brock, Lakonishok, and LeBaron’s (1992) study, “Simple Technical Trading Rules and the Stochastic Properties of Stock Returns,” discovered that EMA crossovers tend to send signals more quickly than SMA crossovers. This is helpful for traders who want to profit from short-term price changes. Their research showed that EMA cross signals resulted in a 2.5% higher annual return on average compared to SMA cross signals.
What is the Success Rate of Golden Cross & Death Cross Signal?
The success rates of acting on golden cross and death cross signals varies, but is around 60-70% over certain time periods. A study by Schaeffer’s Investment Research found that from 1970 to 2009, the success rate of golden crosses in the market was 64%. The success rate of death crosses was 71% in predicting further declines.
However, a report by VectorVest analyzing similar long-term data on the market found success rates of only 61% for golden crosses and 62% for death crosses.
So while these crossover signals are often reliable, real data indicates failures happen sometimes, reinforcing the need to use prudent risk management in technical analysis.


 Previous Article


![15 Investing.com Alternatives [Free+Paid] You Should Use in 2026](https://www.strike.money/wp-content/uploads/2026/04/Investing.com-Alternatives.jpg "15 Investing.com Alternatives [Free+Paid] You Should Use in 2026 22")
![15 TradeStation Alternatives [Free+Paid] You Should Use in 2026](https://www.strike.money/wp-content/uploads/2026/04/TradeStation-Alternatives.jpg "15 TradeStation Alternatives [Free+Paid] You Should Use in 2026 23")
![15 Chartink Alternatives [Free+Paid] You Should Use in 2026](https://www.strike.money/wp-content/uploads/2026/04/Chartlink-Alternatives.jpg "15 Chartink Alternatives [Free+Paid] You Should Use in 2026 24")


 : Definition, Formula, calculation, Uses, Advantages Vs limitations 28")


No Comments Yet.