The falling three candlesticks is a bearish candlestick pattern that is used in technical analysis to predict potential reversals or downtrends in the price of a financial instrument. Falling three candlesticks is a relatively rare pattern that consists of five consecutive candlesticks.
Understanding the falling three patterns is crucial for traders, even those with limited knowledge of the stock market. This pattern serves as a valuable tool to identify potential market shifts, aiding in decision-making for both experienced traders and newcomers alike.
The falling three pattern holds significance in trading as it provides traders with actionable insights. Recognizing this pattern empowers traders to make strategic moves, particularly in the context of short-selling. Traders capitalize on the anticipated downtrend and potentially profit from price declines by understanding this pattern. This pattern acts as a guide, indicating the potential future direction of the market and enabling traders to align their strategies accordingly.
The falling three patterns offer advantages to traders, regardless of their level of expertise. Firstly, its simplicity and visual nature make it accessible to individuals with minimal knowledge of the stock market. This pattern provides a clear signal of potential market reversals, allowing even newcomers to grasp its implications. Additionally, the falling three pattern serves as a versatile tool that can be applied to various timeframes and financial instruments.
This application enables traders to incorporate it into their trading strategies across different markets. Lastly, the falling three pattern complements other technical analysis tools and indicators, enhancing the overall effectiveness of traders’ analyses. Traders enhance their decision-making capabilities and improve their overall trading performance by leveraging the advantages offered by the falling three patterns.
What is a Falling Three Candlestick?
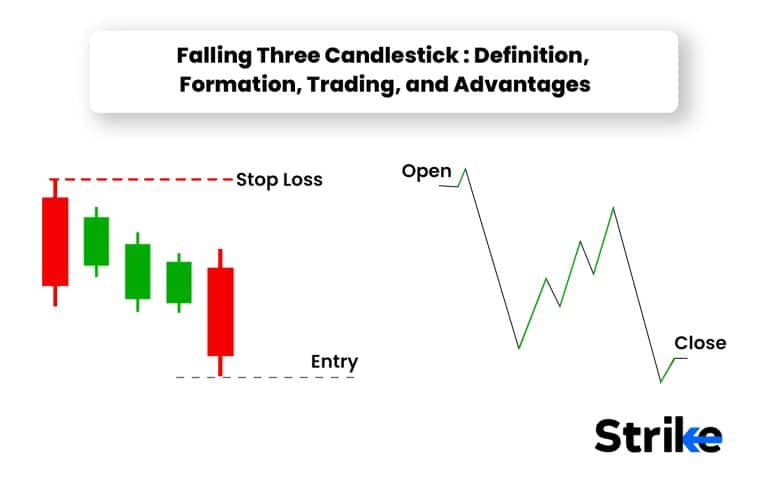
The falling three-candlestick pattern is a bearish pattern in technical analysis that gives us hints about price downtrends in a financial instrument. Let us take a look at the falling three-candlestick pattern. The first candlestick is a long black (bearish) candle that signifies an established downtrend. The second, third, and fourth candlesticks are small-bodied, typically white or black, and have their highs and lows within the range of the first candlestick.

These three candlesticks pattern are referred to as “rising” or “upside gap” candlesticks. The fifth and final candlestick is another long black (bearish) candle that closes below the lows of the three rising candlesticks. This indicates a potential continuation of the downtrend. The falling three-candlestick pattern suggests that despite a brief attempt at an upward correction, the bears regain control, and the downtrend is likely to resume. Traders and analysts often consider this pattern as a signal to enter short positions.
How useful is Falling Three Candlestick?
One of the key advantages of the Falling Three Candlestick pattern is its ability to signal potential reversals or continuations of downtrends. It suggests that traders are experiencing a temporary consolidation or correction within an existing bearish trend when this pattern occurs. Traders interpret this as a warning sign that the bearish momentum might continue, allowing them to adjust their trading positions accordingly. This pattern helps traders identify potential entry points for short positions or tighten their stop-loss orders to protect their positions.
The Falling Three Candlestick pattern is relatively easy to recognize due to its distinct visual appearance. Traders with little experience in technical analysis learn to identify this pattern and incorporate it into their analysis. Its simplicity makes it accessible to traders at different skill levels.
Another benefit is that this pattern is applied to various timeframes and financial instruments. This pattern remains applicable whether you are analyzing stocks, forex, commodities, or other assets. Its versatility allows traders to utilize it across different markets, enhancing its usefulness in their trading strategies.
How Do Falling Three Candlestick Patterns Form?
Falling three candlesticks form through a specific sequence of candlestick patterns. It starts with an initial bearish candlestick, followed by three consecutive rising candlesticks. However, each of these rising candlesticks remains within the high and low range of the first bearish candlestick. This pattern signifies a temporary consolidation or correction within an existing bearish trend. There is a set of rules that traders need to follow in order to identify and confirm its occurrence. These rules serve as guidelines to ensure the validity and accuracy of the pattern.

Below mentioned are the four essential rules that need to be followed for the Falling Three Candlestick pattern:
- Rule of the Initial Downtrend: The Falling Three Candlestick pattern occurs within an existing downtrend. Therefore, the first candlestick in the pattern must be a long black (bearish) candlestick that represents a clear downward movement in the price.
- Rule of the Three Rising Candlesticks: Three consecutive rising candlesticks make up the pattern after the initial bearish candlestick. These rising candlesticks should be relatively small-bodied and have their highs and lows contained within the range of the first candlestick. This signifies a temporary consolidation or correction within the downtrend.
- Rule of Higher Closes: Each of the three rising candlesticks must have a higher close than the previous candlestick. “Higher closes” refers to the price at which each rising candlestick in the Falling Three Candlestick pattern closes in relation to the previous candlestick. Each subsequent rising candlestick’s closing price surpasses the closing price of the previous rising candlestick, indicating “higher closes” in this context. This indicates that despite the attempted recovery, the bulls are unable to sustain upward momentum, and the bearish pressure persists.
- Rule of the Final Bearish Candlestick: The pattern concludes with another long black (bearish) candlestick. This final candlestick should close below the lows of the three rising candlesticks, validating the potential continuation of the downtrend. It confirms that the bearish momentum remains dominant and is likely to persist.
Traders can effectively identify and confirm the Falling Three Candlestick pattern by adhering to these rules. Following these guidelines ensures that the pattern is not misinterpreted and helps traders make more informed decisions based on the anticipated bearish continuation. It is important to remember that the rules of the pattern should be applied within the context of other technical analysis tools and indicators to increase the overall accuracy of trading signals.
Is there a time frame where the Falling Three pattern cannot occur?
The Falling Three Candlestick pattern appears in different timeframes; there is no specific timeframe where it cannot occur. This includes intraday, daily, weekly, and monthly charts. It is a pattern that is observed across different timeframes and financial instruments, making it applicable in multiple market scenarios.
Market conditions, volatility, and the frequency of price movements influence the appearance of specific patterns. There are instances or timeframes where the Falling Three Candlestick pattern is less prevalent or even absent.
The frequency of pattern occurrence is based on the characteristics of the market being analyzed. Highly volatile markets with significant price fluctuations might exhibit the Falling Three Candlestick pattern more frequently, while less volatile or ranging markets may have fewer occurrences.
What does the color green mean in the Falling Three Candlestick Pattern?
The presence of three green candlesticks within the Falling Three Candlestick pattern indicates a temporary pause or consolidation within the prevailing downtrend. It suggests that buyers or bulls are exerting some influence in the market, causing the price to experience short-term upward movement. The overall trend, volume, and other technical indicators should be analyzed to confirm the significance of these green candlesticks.
The presence of short green candlesticks suggests a temporary bullish or corrective phase within the larger bearish trend in the modified pattern. These candlesticks represent a period of uncertainty where buyers are actively trying to halt the downtrend or establish a short-lived upward movement.
What Does the Colour Red Falling Three Candlestick Pattern Mean?
The long red candlesticks signify sustained downward momentum and a resumption of the prevailing downtrend. They indicate that sellers are actively pushing the price lower, potentially creating new lower lows and extending the bearish price action.
Traders interpret the long red candlesticks as a confirmation of the bearish sentiment and use them as a signal to consider entering or maintaining short positions. The length of the candlesticks can provide further insights into the strength of the bearish pressure, with longer candlesticks indicating more significant selling activity.
It is crucial to analyze the overall context, volume, and other technical indicators to validate the significance of the long red candlesticks within the Falling Three Candlestick pattern. By considering these factors, traders actively gain a more comprehensive understanding of the potential continuation of the downtrend and actively make informed trading decisions.
How Many Days Does Falling Three Patterns Take to Develop?
The Falling Three Candlestick pattern typically develops over a span of five trading days. It consists of a series of five consecutive candlesticks, with the first and last candlesticks being long red (bearish) candlesticks. The intermediate three candlesticks are usually smaller in size and have their highs and lows contained within the range of the first candlestick.
Each candlestick represents one trading day, so the entire pattern takes five trading days to form. This timeframe applies to chart intervals, such as daily, weekly, or monthly charts, depending on the timeframe being analyzed.
It’s important to note that the duration of the Falling Three Candlestick pattern varies slightly depending on specific price movements and market conditions.
Traders can effectively identify and analyze the Falling Three Candlestick pattern within the context of other technical indicators and market factors by understanding its approximate duration. This understanding enables them to make informed trading decisions.
When do Falling Three Candlestick Patterns occur?
The Falling Three Candlestick pattern is typically observed during a downtrend or when there is a bearish sentiment in the market. The pattern suggests a potential continuation of the existing downtrend, indicating that selling pressure may persist.
The Falling Three Candlestick pattern is not exclusive to a specific timeframe or market condition, but traders commonly observe it in stock markets, forex markets, and other financial markets. It appears on intraday charts, daily charts, weekly charts, or even longer-term charts, depending on the timeframe being analyzed.
How do you read Falling Three Candlestick Patterns in Technical Analysis?
Reading the Falling Three Candlestick pattern in the technical analysis involves analyzing the specific characteristics and structure of the pattern to understand its potential implications for the market.
Below mentioned are 6 steps on how to read the falling three candlestick patterns.
- Identify the pattern: Look for a series of five consecutive candlesticks on a price chart. The first and last candlesticks should be long red (bearish) candlesticks. The intermediate three candlesticks are smaller in size and have their highs and lows contained within the range of the first candlestick.
- Confirm the downtrend: A clear downtrend or bearish sentiment in the market should precede the Falling Three pattern. This is identified by lower highs and lower lows in the price action.
- Understand the psychology: The pattern suggests a potential continuation of the downtrend. The first long black candlestick signifies strong selling pressure, followed by a temporary consolidation or correction represented by the smaller candlesticks. The last long black candlestick indicates that the bears have regained control, and the selling pressure may persist.
- Consider the volume: Volume analysis provides additional insights. Typically, the volume is highest during the first long red candlestick, showing strong selling activity. The volume decreases during the consolidation phase and increases again during the final long red candlestick.
- Look for confirmation: Traders will have to analyze and incorporate additional technical indicators or chart patterns that align with the bearish outlook to boost the reliability of the pattern. These include trendlines, support and resistance levels, or other bearish reversal patterns.
- Take action: Traders should consider initiating positions once they identify and confirm the Falling Three Candlestick pattern.
In Technical Analysis, the integration of the Falling Three Candlestick pattern with other tools and strategies is highly recommended to gain a more comprehensive market understanding. This approach, a cornerstone of sound Technical Analysis practice, ensures that interpretations and predictions are not based on a single pattern but are instead the result of a holistic analysis. Additionally, it is crucial for traders to practice and validate their Technical Analysis before making trading decisions based solely on this pattern, thereby enhancing the reliability of their market strategies.
How accurate are the Falling Three Candlestick Patterns?
The accuracy of Falling Three Candlestick patterns, like any other technical analysis pattern, varies. It is important to actively note that no pattern or indicator guarantees 100% accuracy in predicting future price movements.
The reliability and accuracy of the Falling Three Candlestick pattern depend on factors including market conditions, timeframe, and the presence of additional confirming indicators or patterns. There are five points to look out for, and they are as follows.
- Market conditions: The pattern will actively tend to have a higher probability of signaling a continuation of the downtrend when the market sentiment strongly leans bearish.
- Confirmation with other indicators: Traders seek confirmation from other technical indicators or patterns to increase the accuracy of the Falling Three Candlestick pattern. This includes trendlines, support and resistance levels, momentum oscillators, or other bearish reversal patterns. The convergence of multiple signals enhances the reliability of the pattern.
- Timeframe: The accuracy of the Falling Three pattern varies depending on the timeframe being analyzed. It is important to consider the pattern in the context of the specific time frame and align it with the trading strategy being employed.
- False signals: The Falling Three pattern is not immune to false signals or market noise. It is crucial to exercise caution and not rely solely on the pattern without considering other factors, such as volume, market context, or fundamental analysis.
- Practice and experience: Accurately interpreting and utilizing Falling Three Candlestick patterns requires practice and experience. Traders need to develop a keen eye for spotting patterns and validating them with proper analysis techniques.
The accuracy of Falling Three Candlestick patterns can vary depending on market conditions, timeframe, and the presence of confirming indicators or patterns. Traders use the pattern to gain valuable insights into potential bearish continuation by analyzing different tools and developing a well-rounded trading approach. Risk management and proper validation of signals are crucial to successful trading.
Can you improve the Falling Three Candlestick accuracy?
No, the accuracy of the Falling Three Candlestick pattern cannot be improved because it is a historical pattern based on past price movements and market behavior. Technical analysis patterns, including the Falling Three, rely on the interpretation of price data and patterns to make predictions about future price movements. However, market conditions are dynamic and subject to a variety of factors, making it impossible to guarantee the accuracy of any pattern with certainty.
How can I evaluate the Falling Three pattern’s efficacy using a backtest?
You can get an idea of how effective the Falling Three pattern has been in the past and whether it can be helpful in your trading approach. Decide on the specific characteristics that make up the Falling Three pattern. This includes how many candlesticks are involved, their colors, and where they are positioned on the price chart. Select past price information for the market or asset you want to test. This data can be from daily, weekly, or monthly timeframes.
Go through the historical data and search for instances of the Falling Three pattern based on the criteria you defined earlier. Make a note of the dates and prices when the pattern occurred. Study what happened to the price after each occurrence of the Falling Three pattern. Did it correctly predict a continued drop in price? Did it lead to profitable trading opportunities? Calculate some simple performance measures to evaluate the pattern’s effectiveness.
For example, how often did it result in successful trades? What was the average profit or loss from those trades? Use basic statistical techniques to determine if the results you observed are reliable and not just due to chance. This helps you understand if the pattern’s performance is statistically significant. Repeat the process for different time periods or markets to make sure the pattern consistently shows similar results. This helps confirm its usefulness.
What is the success rate of the Falling Three Candlestick Patterns?
The success rate of Falling Three Candlestick patterns depends on factors like market conditions, timeframe, and confirmation from other indicators. Falling Three patterns tend to be more successful in established downtrends with strong selling pressure. Confirming the pattern with other indicators like trendlines or support/resistance levels actively improves its accuracy.
We are also obliged to look out for false signals and market noise since they can decrease the success rate. It’s important to remember that no pattern guarantees 100% success. Traders should manage risk, use proper position sizing, and continually evaluate the pattern’s effectiveness to make informed decisions.
How do you trade using the Falling Three Candlestick Pattern?
Trading using the Falling Three Candlestick pattern involves a combination of pattern recognition, confirmation, and appropriate trading strategies. First, look for the characteristics of the Falling Three pattern, which consists of a long bearish candlestick followed by three consecutive small bullish (green) candlesticks and, finally, a long bearish candlestick that closes below the first candlestick’s low. Confirm that the pattern matches the criteria before considering a trade. Increase the reliability of the Falling Three pattern by confirming it with other technical indicators or patterns.
Look for additional bearish signals, such as trendline breaks, overbought conditions on oscillators like the RSI, or bearish chart patterns like head and shoulders. These confirmations help strengthen the trading signal. It is always important to enter a short trade when you confirm the Falling Three Candlestick. The entry can be placed below the low of the last bearish candlestick in the pattern. The best risk management method is to set a stop-loss order above the high of the last bearish candlestick or at a predetermined level where the pattern would be invalidated. Determine your profit target based on your risk-reward ratio and other supporting factors. This is done by identifying potential support levels and previous swing lows or using Fibonacci retracement levels.
Consider taking partial profits along the way or trailing your stop-loss to protect profits as the trade progresses. Proper risk management is crucial when trading the Falling Three pattern or any other strategy. Calculate your position size based on your risk tolerance and the distance between your entry and stop-loss levels. Maintain discipline and adhere to your risk management plan to protect your trading capital. Keep a close eye on the trade as it develops. Consider adjusting the stop-loss to protect profits or implementing a trailing stop to capture more gains if the price is moving in your favor. Be prepared to exit the trade according to your predetermined stop-loss level if the price is moving against you and invalidates the pattern.
It is essential to combine the Falling Three pattern with proper risk management, ongoing analysis, and adherence to your trading plan. There is no trading pattern or strategy that guarantees success in every trade. The only way to track is to constantly monitor market conditions and be adaptable to make informed decisions based on the evolving price action.
What are Examples of Falling Three Candlestick Patterns?
Examples of the Falling Three Candlestick pattern can be found in all types of stocks within the stock market. Let’s take a look at two instances of falling three candlestick pattern:

Example 1
- The first candlestick is a long red (bearish) candlestick, indicating a significant downward move in price.
- The following three candlesticks are small green (bullish) candlesticks, suggesting a temporary pause or consolidation in the downward movement.
- The final candlestick is another long red candlestick, which closes below the low of the first candlestick. This confirms the continuation of the downtrend.
Example 2
- The first candlestick is a long red (bearish) candlestick, signifying strong selling pressure in the market.
- The next three candlesticks are small green (bullish) candlesticks, reflecting a brief period of indecision or a minor price correction.
- The final candlestick is a long red candlestick that closes below the low of the first candlestick, indicating the resumption of the downtrend.
These examples demonstrate instances where the Falling Three Candlestick pattern can be observed in specific stocks within the stock market. The pattern indicates a temporary pause or consolidation in a prevailing downtrend, followed by a continuation of bearish momentum.
Should volume be taken into account while trading the Falling Three pattern?
Yes, the volume should be taken into account while trading the Falling Three pattern. The volume can provide valuable insights into the strength and validity of the pattern. Volume is the number of shares traded in the stock market. The most important thing we need to consider when we trade the Falling Three pattern is the volume. Higher volume during the pattern confirms its reliability and shows more traders are selling. This means the pattern is stronger.
What Trading Indicator Works Best with a Falling Three Candlestick Pattern?
A single indicator will not work best with the Falling Three Candlestick pattern.
There are 5 indicators that can complement its analysis.
- Moving Averages: Moving averages help identify the overall trend and provide support and resistance levels. They can confirm the direction of the Falling Three pattern and offer additional entry or exit signals.
- Relative Strength Index (RSI): The RSI measures the overbought or oversold conditions of an asset. It can help determine if the price is reaching extreme levels and potentially signal a reversal or continuation of the trend.
- Volume: Volume confirms the strength and validity of the Falling Three pattern. Higher volume during the pattern formation adds credibility to the bearish sentiment, while divergences with volume can indicate potential weakness.
- Trendlines: Drawing trendlines on the price chart can help identify the overall trend and provide additional confirmation for the Falling Three pattern. The intersection of the trendline with the pattern can act as a strong resistance level.
- Support and Resistance Levels: Identifying key support and resistance levels can help validate the Falling Three pattern. These levels can provide additional confirmation for potential entry and exit points.
It’s important to note that no single indicator guarantees accuracy in trading. Combining multiple indicators can provide a more comprehensive analysis and improve the overall effectiveness of the Falling Three Candlestick pattern.
Do Bollinger Bands and Falling Three Candlestick Patterns Work?
Yes, Bollinger Bands and the Falling Three Candlestick pattern can work as effective technical analysis tools. Both have their own merits and provide valuable insights into market trends and potential trading opportunities. Bollinger Bands help identify volatility, support and resistance levels, and potential price breakouts. They are used to assess market conditions and make trading decisions based on price movements relative to the bands.
What are the advantages of the Falling Three Candlestick Pattern?
The Falling Three candlestick pattern offers active traders advantages in their market analysis and decision-making process. The pattern offers 5 distinctive advantages for traders and investors.
1.Pattern Recognition
The Falling Three pattern is a well-defined and easily recognizable candlestick pattern. Its distinct formation makes it relatively easy to spot on price charts. This helps traders quickly identify potential bearish continuation patterns.
2. Bearish Continuation Signal
The Falling Three pattern serves as a bearish continuation signal within a prevailing downtrend. It suggests that after a brief consolidation or pause, the downtrend is likely to resume. Traders utilize this pattern to confirm and reinforce their bearish bias, enabling them to make informed trading decisions.
3. Entry and Exit Points
Traders actively identify potential entry points for short-selling or other bearish trading strategies by recognizing the Falling Three pattern. The pattern provides a specific price level that is used as a trigger for entering a trade. It also offers an exit point if the price breaks below the low of the pattern’s final red candle.
4. Risk Management
The Falling Three pattern assists in managing risk by providing a defined stop-loss level. Traders set their stop-loss orders above the high of the pattern’s final red candle to limit potential losses if the pattern fails to materialize as expected.
5. Compatibility with Other Tools
The Falling Three pattern is effectively used in conjunction with other technical analysis tools and indicators to enhance trading decisions. Traders often combine it with trendlines, moving averages, or oscillators to strengthen their analysis and increase the probability of successful trades.
It is important to note that while the Falling Three Candlestick pattern offers advantages, it is not infallible and should be used in conjunction with other forms of analysis and risk management techniques. It is always advisable to consider the overall market context and conduct a thorough analysis before making important trading decisions.
What are the disadvantages of the Falling Three Candlestick Pattern?
It is true that the Falling Three Candlestick pattern has its advantages, but it also has five limitations or disadvantages that traders should be aware of.
1.Reliability Issues
Traders should always keep in mind that the Falling Three pattern is not 100% reliable. There are instances where the pattern fails to produce the expected bearish continuation. It’s important to remember that no single pattern or indicator can guarantee accurate predictions in the market. Traders should use the Falling Three pattern in conjunction with other tools and analysis techniques to increase the probability of successful trades.
2. Limited Timeframe
The Falling Three pattern typically occurs within a relatively short time frame. It is a short-term pattern and may not provide significant insights for longer-term trading or investment strategies. Traders with longer time horizons need to consider additional indicators or patterns to complement their analysis.
3. Interpretation Challenges
Interpreting the Falling Three pattern requires experience and skill. It involves analyzing the relationship between candlestick sizes, their positioning, and the overall market context. It can be challenging for novice traders to correctly identify and interpret the pattern, leading to potential misinterpretations and trading errors.
4. Market Conditions
The Falling Three pattern’s effectiveness varies depending on market conditions. The pattern will show great reliability in strongly trending markets, whereas in sideways markets, the predictive power will decrease. Traders should consider the overall market environment and apply the pattern accordingly.
5. False Signals
The Falling Three pattern creates false signals just like any other pattern. There are instances where the pattern appears to form but fails to lead to the expected bearish continuation. Traders should be cautious and validate the pattern with other confirming indicators or patterns before making trading decisions.
No pattern or indicator guarantees trading success. Traders should combine the Falling Three pattern with other analysis tools and risk management techniques and consider the overall market situation to make better decisions.
Can the Falling Three pattern occur in any market?
Yes, the Falling Three pattern occurs in any market. The pattern is a bearish continuation pattern, indicating a potential resumption of a downtrend. It is observed in markets, including stocks, commodities, forex, and others. The underlying principles of the pattern remain the same, regardless of the market being analyzed.
Is Falling Three Bearish or Bullish?
The Falling Three pattern is considered bearish. The pattern itself is a bearish continuation pattern that suggests a potential resumption of a downtrend. It is characterized by a series of small green candles (representing temporary price consolidation) sandwiched between two long red candles (indicating bearish pressure).
How does the Falling Three pattern differ from other bearish patterns like the Bearish Engulfing and Dark Cloud Cover?
The Falling Three pattern differs from other bearish patterns like the Bearish Engulfing and Dark Cloud Cover in terms of its specific candlestick formation and the nature of its bearish signal. The Falling Three pattern is characterized by a series of three small green candles (representing temporary price consolidation) sandwiched between two long red candles. This pattern suggests a brief pause or consolidation within a prevailing downtrend, indicating that bearish pressure is likely to continue. The pattern is considered a bearish continuation pattern, providing a signal for further downward movement in price.
What is the difference between Falling Three Candlestick and Rising Three Candlestick?
The Falling Three Candlestick pattern and the Rising Three Candlestick pattern are two distinct candlestick formations that signify different market conditions and provide different trading signals. The Falling Three pattern is a bearish continuation pattern that occurs within a downtrend. It consists of a long red candle followed by three small green candles and another long red candle. This pattern suggests a temporary consolidation or pause in the downtrend, signaling a potential continuation of bearish momentum. The small green candles within the Falling Three pattern represent price consolidation or a short-term pause in selling pressure.
The Falling Three pattern confirms the prevailing downtrend and provides a signal for traders to consider bearish strategies, such as short-selling or exiting long positions.
The Rising Three pattern is a bullish continuation pattern that occurs within an uptrend. It consists of a long green candle followed by three small red candles and another long green candle. This pattern suggests a temporary consolidation or pauses in the uptrend, indicating a potential continuation of bullish momentum. The small red candles within the Rising Three pattern represent price consolidation or a short-term pause in buying pressure. Traders anticipate the resumption of overall bullish sentiment despite the consolidation. The Rising Three pattern confirms the prevailing uptrend and provides a signal for traders to consider bullish strategies, such as buying or holding long positions.


 Previous Article


![15 Investing.com Alternatives [Free+Paid] You Should Use in 2026](https://www.strike.money/wp-content/uploads/2026/04/Investing.com-Alternatives.jpg "15 Investing.com Alternatives [Free+Paid] You Should Use in 2026 40")
![15 TradeStation Alternatives [Free+Paid] You Should Use in 2026](https://www.strike.money/wp-content/uploads/2026/04/TradeStation-Alternatives.jpg "15 TradeStation Alternatives [Free+Paid] You Should Use in 2026 41")
![15 Chartink Alternatives [Free+Paid] You Should Use in 2026](https://www.strike.money/wp-content/uploads/2026/04/Chartlink-Alternatives.jpg "15 Chartink Alternatives [Free+Paid] You Should Use in 2026 42")
: Overview, 10 Types of Indicators, Settings for Different Markets 43")


 : Definition, Formula, calculation, Uses, Advantages Vs limitations 46")


No Comments Yet.