Double Top Pattern: Definition, Formation, What It Indicates, Parts and Trader’s Thoughts
A double-top pattern is a price chart candlestick formation that signals an extreme bearish trend reversal. A double-top candlestick pattern forms when the price of an asset reaches a high for the second time consecutively with a decline between the two highs. A strong and prolonged market decline usually follows the double-top pattern.
The double-top candlestick formation roughly resembles the letter ‘M’ of the English alphabet. A double-top candlestick pattern forms over a long period of time. The first high usually forms after a strong uptrend. A moderate decline follows the first high or peak, continuing until the price drops to a support level or neckline. The price then moves in an upward trend until it reaches a second peak. The price trend follows a steady downward movement after the second peak, moving past the support level or neckline. Traders confirm the double-top formation when the second downward movement breaks the neckline and moves further down.
What is a Double Top Pattern?
Double top is a bearish reversal chart pattern that occurs after a stock reaches similar high prices in two sessions with a drop in price in between. Double top pattern, which looks like the letter ‘M’, is a signal of upcoming prolonged bearish trend.

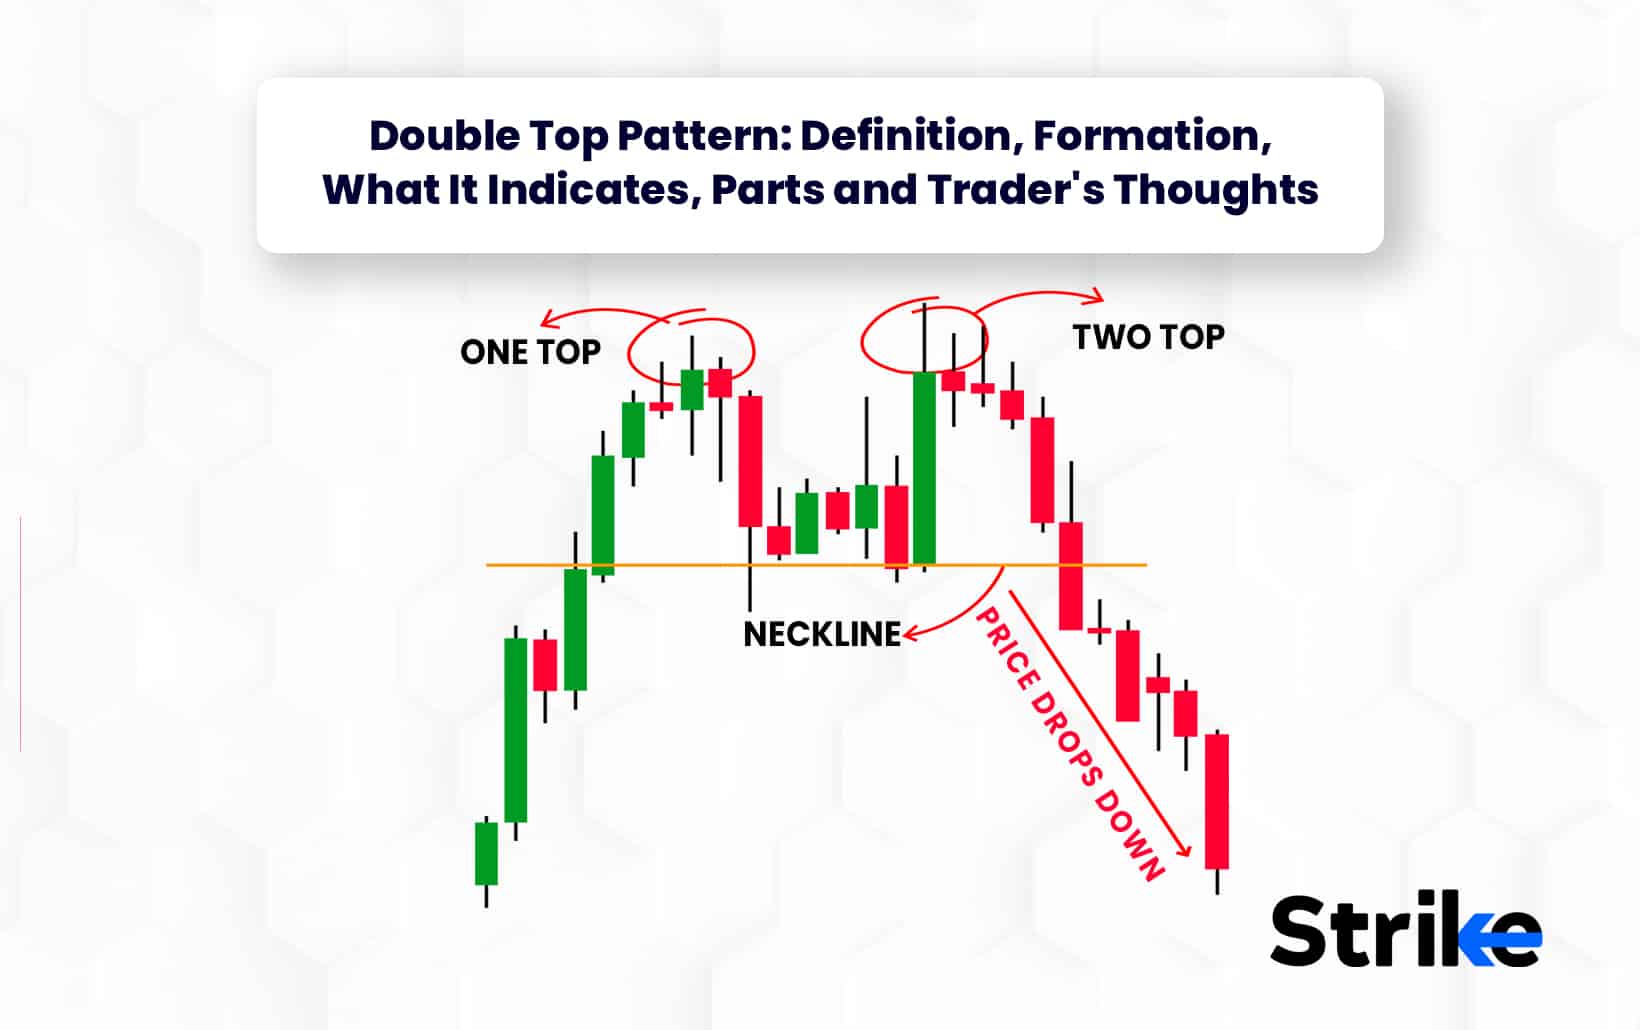
The image above depicts a double-top pattern. The image shows that a double-top pattern comprises two highs or peaks with a moderate low in the middle. The low in the middle is known as the neckline. The neckline is a support level that is formed after the first price decline following the first peak. The second peak forms as a result of the upward price movement following the formation of the neckline. The double-top pattern is complete when the price follows a downward trend after the formation of the second peak. The price breaks the neckline and moves further down confirming the upcoming bearish trend. A double-top pattern usually forms towards the end of a strong uptrend and foreshadows an extremely bearish market.
What Does Double Top Pattern Indicate in Technical Analysis?
The double-top pattern indicates an extreme bearish trend reversal. A double-top pattern usually forms towards the end of a strong uptrend. The buyers are in a dominating position with the demand for the security prevailing over its supply, in the initial phase of the double-top formation. The trend then reverses and the sellers start to gain a prevailing position. The sellers drive the prices down leading to the formation of a valley.
The supply takes over the demand, during the formation of the valley. The buyers gain the dominant position again following the valley, as the demand starts to go up, leading to a second peak. The bears or sellers win the struggle with the bulls or buyers again once traders realise that the upward price movement does not go beyond the previous peak. The sellers then drag the prices down and the market faces a strong bearish phase.
The double-top pattern is confirmed when the downtrend that follows the second peak breaks the neckline and moves further down.
How to Describe the Formation of Double Top Pattern?
A double-top pattern is formed as a result of the push-and-pull struggle between the bears and the bulls.

The image above indicates a double-top pattern formation. The double pattern formation begins at the end of a strong uptrend when the bulls are in a dominating position. The demand for the security is very high at the start of the double-top pattern formation and the bulls drive the prices higher until it reaches a high, which is indicated as top 1 in the image. The peak formed here, as the image shows, is a resistance level as the price does not rise beyond this level.
The price then starts to make a downward move as the supply for the security dominates over its demand. The image shows that the downward movement ends in a low, which forms the centre of the letter ‘M”. The low point that forms a neckline for the pattern is the support level as the price does not go lower than this level at this point. The bulls again drive the prices higher until it reaches either the level of the first peak or slightly below it.
The image above indicates the second peak as the top 2. The formation of the second resistance level indicates that the bulls are unable to The bears again take over, once the second peak is reached. The bears drive the prices lower and lower as the supply for the security exceeds the demand. The second downward price movement, as the image shows, does not stop at the support level that was previously created. It breaks out of the support level and moves further down, creating a strong and probably prolonged bear market.
What Do Traders Think About the Double Top Pattern?
Traders think of the double-top pattern as a signal of an upcoming extreme bearish trend reversal. Traders trading in stocks and forex often rely on double top patterns, as the pattern is most effective for predicting trend reversals in the forex and stock markets. Traders consider the double-top pattern a bearish trend reversal pattern as it always appears at the end of a bullish trend and brings about a lowering in the market prices. The pattern comprises five parts including a top 1, top 2, bottom, a neckline and a breakout point. Trading with the double top pattern involves waiting for the confirmation of the bearish trend reversal and then using trading techniques such as shorting. Traders commonly open a short position at the top of the second high to maximise the profits from the bearish trend reversal.
Traders prefer to use the double-top pattern primarily owing to the advantages that it includes. The two main advantages of using the double-top pattern include its ability to be used in different financial markets and its ability to be used in all time frames. The two main disadvantages of the double-top pattern are its tendency to produce false signals and the difficulty involved in spotting and confirming the pattern. The double-top pattern is confirmed only when the second price drop crosses the low of the neckline that was formed by the initial price drop.
What are the Parts of a Double-Top Pattern?
A double-top pattern comprises five main parts including two tops, a low, a neckline and a breakout point. The image below clearly depicts the various parts of the double-top pattern.

A double-top pattern must have five key parts to be categorised as a double-top pattern. The five parts of the double-top pattern are listed below.
First Top. The first top is the peak of the double-top pattern before the price starts to drop. The first top appears at the end of a strong ongoing uptrend. The image above indicates the first top.

Low. The second part of the double-top pattern is the low that is formed. This low represents the neckline of the pattern, following which the price again starts to rise.
Neckline. The third part of the double-top pattern is the neckline. The neckline represents the level at which the low forms a support level.
Second top. The fourth part of the pattern is the second peak which is known as the second top. The second top is formed at a price level equal to that of the first peak or slightly below it and will not rise beyond the first peak. Traders and investors must note that the second top rarely reaches the same level as the first one and that the ‘M’ shape does not always be symmetrical.
Breakout point. The fifth part of the double-top pattern is the breakout point. The breakout point marks the point where the price breaks out of the support level created by the neckline and moves further down.
The downward price movement that follows confirms the bearish trend reversal. The breakout point is a crucial aspect of the double-top pattern as it is what confirms the bearish trend reversal.
Is the Double Top Pattern a Good Signal for a Trade?
Yes, the double top pattern is a good signal for selling the security rather than buying it, as it marks the end of the bullish trend and the beginning of a bearish trend. Traders usually opt for trading techniques such as shorting to make the best of the trend reversal.
How To Trade Using the Double Top Pattern?
Trading using the double top pattern involves the use of bear market trading strategies such as shorting or holding on to the securities until there is a bullish trend reversal. There are mainly three steps to trading using the double-top pattern, which are listed below.
Firstly, identifying a double-top pattern. The first step to trading using the double-top pattern is identifying the double-top pattern on the security’s price chart. A double-top pattern is identified using its distinct shape that resembles the letter ‘M” of the English alphabet. A double-top pattern looks similar to the double-top pattern in the image below.
The image shows that the double-top pattern comprises two peak points with a single low point in between. The image also shows that the double-top does not necessarily need to be a symmetrical ‘M’. The second peak, as the image shows, often falls below the first peak, although it never goes beyond the level of the first peak.
Secondly, confirming the double-top pattern. The second step to trading with the double-top pattern is confirming the pattern. A double-top pattern can be confirmed only once the downtrend after the second peak breaks out of the neckline and moves further down.
The price chart above shows how a double-top pattern is confirmed. The bearish trend reversal is confirmed once the second price drop breaks the support level formed by the first price drop. It is important to wait for the double-top confirmation before making any trading decisions to prevent incurring losses.
Lastly, Using the appropriate trading strategies. The last and final step to trading with the double-top pattern is to apply the appropriate trading strategies. Investors and traders commonly use shortening to make the best possible gains from the bearish trend reversal. Shorting refers to the practice of borrowing securities from others right before a bearish trend and selling them, and then buying the securities back once the prices have dropped and returning them to the lender.
Investors and traders can utilize these steps to use the double-top pattern to trade in forex or stock markets. The trading strategies that investors and traders commonly use tend to be ones that are used in bear markets. Most traders sell securities short following a double-top pattern. Some traders, however, wish to purchase the securities in the bear market, when the prices are less and hold on to them until the market turns bullish.
What are the Benefits of Double Top Patterns?
Double-top patterns are highly beneficial to traders trading in stocks and forex, especially because it predicts upcoming bearish reversals. Investors and traders get to plan their investment and trading strategies better by using the double-top pattern signals. The two main advantages of double-top patterns are listed below.
Ability to be used in different financial markets. The greatest advantage of the double-top pattern is its versatility. The double-top pattern is used in different financial markets, making it a useful tool for traders across various financial market platforms. The double-top pattern functions exceptionally well in the forex and stock market.
Ability to be used in different time frames. The second main advantage of the double-top pattern is that it is used with various time frames. The double-top pattern works well in a range of time frames from one or five-minute ones to time frames lasting even a month. The double-top pattern is thus able to cater to the needs of different traders.
The bearish trend reversal signals that the double-top pattern produces also help investors and traders alter their trading strategies. Investors and traders need to design different strategies for the bearish trend reversal especially since the reversal follows a string and prolonged bullish trend.
What are the Limitations of Double Top Patterns?
The main disadvantage of the double-top pattern stems from the fact that they occur very rarely. Investors and traders, therefore, do not get much experience trading with it. Double-top patterns are also susceptible to making false signals. The two main disadvantages of the double-top pattern are listed below.
Tendency to produce false signals. A major disadvantage of the double-top pattern is that it is susceptible to producing false signals. False signals can lead to huge losses for investors and traders if they act on them. Investors and traders must use the double-top pattern along with other technical indicators to remain on the cautionary side.
Difficulty in spotting and identifying the double-top pattern. The double-top pattern occurs very rarely and it is not very easy to spot it on the price chart. The reason for the difficulty in spotting the double-top pattern is that it not always be a perfectly symmetrical ‘M’ making it harder for traders to identify it.
Another disadvantage that investors and traders face while using the double-top pattern is that they need to wait to confirm the pattern signal before applying their trading strategies. The double-top pattern can be confirmed only after the second downward price action breaks the support level created by the first downward price action.
Why is Double Top Pattern a Bearish Technical Reversal Pattern?
A double-top pattern is a bearish technical reversal pattern because it brings about an extremely bearish trend. A double-top pattern in technical analysis chart occurs at the end of a prolonged and strong bullish trend and brings about a decline in security prices. The downtrend that occurs following the second peak in a double-top formation usually brings about an extremely bearish trend.
How to Confirm Double Top Pattern with a Break Below Support?
A double-top pattern is confirmed using a break below support by waiting for the second price downtrend to cross the support line created by the low of the pattern.

The image above shows how a double-top pattern can be confirmed. Investors and traders must pay close attention to the price downtrend that takes place following the second top. The double-top pattern is confirmed when the downtrend breaks the support level created by the low between the two previous highs. The neckline, on the image, here, represents the support level that the low between the highs created. The support level refers to a price level beyond which the price does not decline over a while. A break below the support level or neckline confirms the double-top pattern formation and indicates an upcoming bearish trend reversal.
What is an example of a Double Top Pattern?
The price chart below represents a double-top pattern formation.

The image above shows the price chart of the stocks of Tata Motors Ltd. The chart indicates that the double-top pattern forms at the end of a strong uptrend. The first top takes the stock prices to Rs 154.50 per share. The prices then start to drop and reach a low of Rs 141.50. A support level forms at this price level as the price does not decline after this point. The prices then start to increase reaching a second top at around Rs 153.50 per share. The prices again started to decline after the formation of the second top. The decline is more steady this time and it breaks the neckline or support level of Rs 141.50 and drags the prices further lower, thereby, confirming the bearish trend reversal. Investors and traders using the double-top pattern can place a stop-loss order just above the second top at Rs 153.50 per share.
How Important It Is to Place your Stop Loss when Trading?
It is extremely useful to place stop losses when trading using double-top patterns. A stop loss is an order that can automatically sell securities when the price reaches a certain level. Stop losses protect investors and traders from incurring high losses. Investors trading with the double-top pattern must place a stop-loss order just above the second top. A stop loss just above the second top can help investors maximize their gains. Traders tend to face huge losses when stop-loss orders are not used as the prices plummet following the second top.
Why you Should Set your Profit Goal?
A profit goal is necessary while trading with the double-top pattern as it can minimise the volatility of trade. The profit goal for the double-top pattern is usually kept at two or three times the distance between the neckline and the double tops. A profit goal is a predetermined price that the investor sets at which point he/she will exit the trade making a profit. Profit goals are set at certain price levels at the time of entering the trade. Profit goals help to reduce the volatility of the investment made. Huge losses are incurred if the traders choose to rely on open profits and the risks involved with open profits is high.
Does the ‘M’ Shape Indicate a Bearish Reversal Trend for Double Top Pattern?
Yes, the ‘M’ indicates a bearish trend reversal for the double top pattern as the shape ends with a downward movement. The double-top pattern forms at the end of a bullish uptrend and witnesses a price drop to a low. The prices then pick up from the low to a level close to the prior high. A downward movement follows the second high, completing the ‘M’ shape and confirming the bearish or downward trend reversal.
Is Double Top One of the Important Patterns Used for Technical Analysis by Traders?
Yes, the double-top pattern is an important pattern that traders use in technical analysis. The double-top pattern is a useful tool in predicting bearish trend reversals and is particularly useful in the stock and forex markets.
Are There Rules when Using Double Top Pattern for Trading?
Yes, there are primarily two rules which must be followed while trading with the double top pattern including proper identification and proper confirmation of the pattern. Proper identification implies that the pattern must have two highs and a low in between. The price retracement after the second high must be more drastic than the initial retracement. The second must also not break the resistance level created by the prior high.
Proper confirmation implies that investors must confirm the pattern only once the second retracement breaks the support line created by the low. It is also advisable to use stop-loss orders and profit goals to minimize any losses.
Is Double Top a Bearish Reversal Pattern?
Yes, the double top pattern is a bearish reversal pattern as it appears at the end of a bullish trend and signals a shift to a bearish market trend marked by declining security prices among other chart patterns.
What is the Difference between Double Top Pattern from Double Bottom Pattern?
The main difference between the double-top and double-bottom patterns is that the double-top pattern is a bearish trend reversal pattern and the double-bottom pattern is a bullish trend reversal pattern. The ‘M’ shaped double-top pattern, is the exact opposite of the ‘W’ shaped double-bottom pattern.
Share


No Comments Yet