Diamond Pattern: Definition, Key Characteristics, Example, How It Works, and How to Trade It?


The diamond chart pattern is a technique used by traders to spot potential reversals and make profitable trading decisions. Diamond patterns often emerging provide clues about future market movements.
In a diamond pattern, the price action carves out a symmetrical shape that resembles a diamond. This occurs as buyers and sellers battle for control, getting squeezed into an ever-tightening range. The tension builds beneath the surface until one group ultimately breaks the stalemate.
By analyzing these subtle shifts in investor psychology and momentum, technical analysts seek to gain an “edge” over the unpredictable nature of markets. The diamond presents traders with an objective roadmap to anticipate trend changes in advance. When identified early enough, it opens doors to capitalize on the ensuing breakout move through well-timed entries and exits.
This article provides a comprehensive overview of how the diamond pattern operates, including its key characteristics, mechanics, methods of validation, and strategies for incorporation into a disciplined trading framework. With a solid understanding of its predictive power and benefits, readers can better weaponize this visual tool to make informed choices and optimize financial outcomes.
What is the Diamond Chart Pattern?
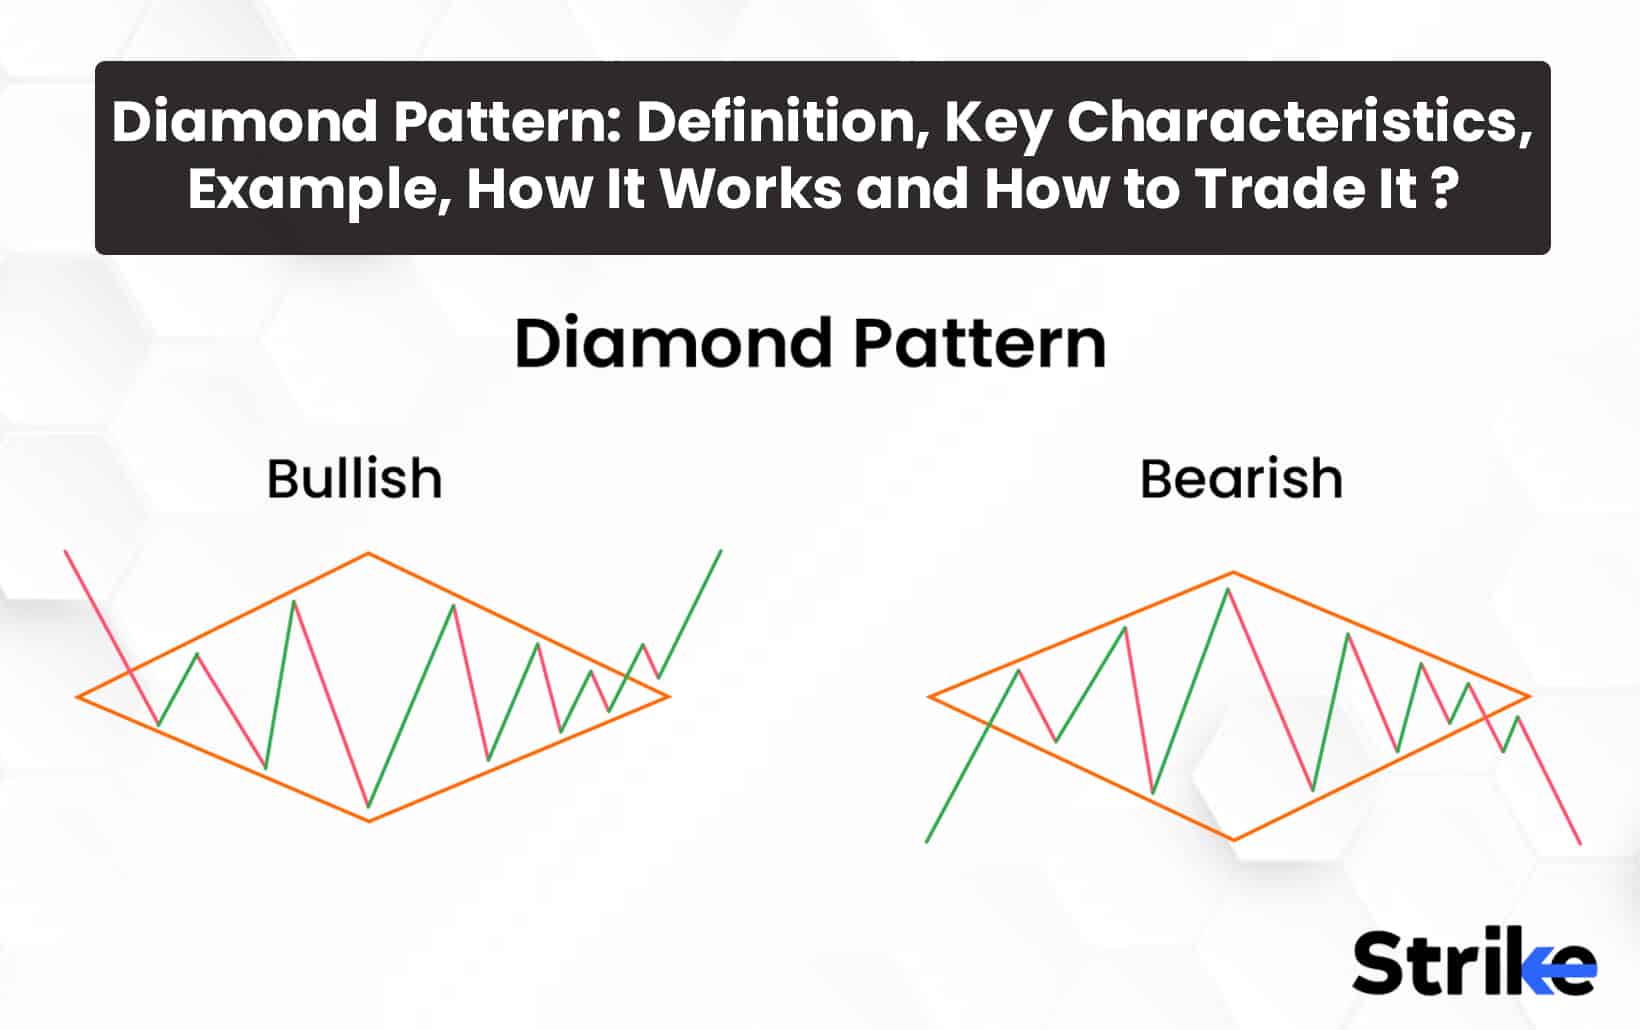
The diamond chart pattern is a technical analysis pattern that shows trends in a stock’s price movement. The diamond pattern is considered a reversal pattern, as it shows a transition from an uptrend to a downtrend or vice versa. It gets its name from the diamond shape that is created when trendlines are drawn, connecting the highs and lows. The diamond pattern forms over a period of time as the stock price hits lower highs and lower lows. This forms the upper descending trendline connecting at least two lower highs. At the same time, the lower ascending trendline connects at least two higher lows. The trendlines converge from the diamond shape.

The diamond pattern in technical analysis forms when the price makes a higher high, then reverses into a downtrend and makes a lower low, followed by another reversal into an uptrend with a lower high, and finally, the downtrend loses momentum with a higher low. This sequence creates a diamond shape on the chart, reflecting transitions between uptrends and downtrends. These four points form the outline of the diamond shape. The distance between the upper and lower trend lines defines the height of the pattern, and the distance along the trendlines defines the length or duration of the pattern. Larger chart patterns are considered more significant.
How Does Diamond Chart Pattern Work?
The diamond chart pattern works by providing visual cues on a price chart that indicate when a stock is consolidating within a defined price range after a strong move up or down. The pattern forms when the price begins to compress into a tightening triangle or “diamond” shape, reflecting a balance between buyers and sellers as the trend stalls. It signals that either the bulls or bears have overpowered the other side, and the previous trend is likely to reverse when the diamond pattern completes and breaks out from the consolidation.
Specifically, the diamond pattern is considered a reversal pattern as it shows a transition from an uptrend to a downtrend or vice versa. As the uptrend begins to lose momentum, the trading range tightens and forms higher lows and lower highs, which contract into a diamond shape. This demonstrates the tug-of-war between buyers trying to push the price up and sellers trying to drive it down. The pattern isn’t complete until the price breaks beyond the upper or lower trendlines of the diamond, called the breakout.
It indicates the bulls have regained control, and upside momentum is accelerating if the breakout happens above the upper trendline. The breakout signals the uptrend is resuming, and traders will want to consider entering new long positions. Conversely, suppose the price breaks down below the lower trendline of the diamond; it means the bears have overwhelmed demand, and the downtrend is likely to continue. The breakdown suggests exiting longs or initiating new short positions.
The power of the diamond pattern comes from the buildup of tension as the price coils tighter and tighter within the converging trendlines. It tends to be an explosive move as this pent-up energy is released when the breakout finally occurs. The pattern reflects a shift in the sentiment and positions of market participants that drives a trend reversal.
What are the Key Characteristics of the Diamond Chart Pattern?
The four key characteristics to identify when analyzing diamond chart patterns in stocks are given below. It involves recognizing consolidating price action, contracted volatility, reduced volume, and validated breakouts.
1. Price Consolidation
The essence of the diamond pattern is the visual shape created by price consolidation, where after a trend, the price compresses into a tight trading range shown by upper and lower trend lines connecting the swing highs and lows to form a symmetrical diamond shape, reflecting decreasing volatility as the trend momentum stalls.
2. Duration
The diamond pattern generally forms over a period of 1 to 3 months, which allows sufficient time for the upper and lower trendlines to develop as the trading range contracts, while durations that are too short but do not fully consolidate the trend and longer durations could indicate a weaker signal.
3. Volume
The diamond pattern should exhibit decreasing trading volume as the price consolidates, indicating waning buying and selling pressure, followed by a spike in volume on the breakout above average levels, confirming a surge of momentum driving the new trend.
4. Breakouts
The diamond pattern exhibits a valid breakout when the price closes outside the pattern beyond the upper or lower trendline, signaling bulls or bears have overwhelmed the opposing side to regain control, and the previous trend will now reverse.
Combining these characteristics allows traders to anticipate trend reversals early and profit from the emerging up or down move. Detecting diamonds quickly is a valuable skill in stock chart analysis.
How Can the Diamond Chart Pattern be Used in Connection with Other Technical Analysis Indicators?
The diamond chart pattern is effectively used in connection with other technical analysis indicators to validate the pattern, time entries, and exits, set profit targets and stop losses, and improve overall trading performance. The diamond and confirming indicators create a robust system for trading trend reversals when integrated together. Trend lines are extremely useful for identifying the diamond pattern itself.
Connecting swing highs and lows using trend lines clearly delineates the converging upper and lower boundaries of the diamond shape. The eventual break of the uptrend or downtrend line signals the completion of the pattern and reversal. Moving averages also validate and strengthen diamond signals. Crossovers such as the 50-day moving average crossing above the 200-day moving average as the price breaks above the diamond corroborate the new upside trend.
Momentum oscillators are important for gauging whether upside or downside momentum is strengthening or weakening during diamond formation. As the pattern develops, oscillators like RSI and Stochastics converge toward overbought or oversold levels before reversing direction. The oscillator turn aligns closely with the price breakout, confirming the momentum shift. Divergences between oscillator readings and prices also warn of impending trend changes.
How to Trade Using the Diamond Chart Pattern in Forex?
Follow these 5 steps to effectively trade diamond chart patterns.

Identify the Diamond
To trade the diamond pattern, first, identify an uptrend or downtrend and draw trend lines connecting the swing highs and lows. Look for price consolidating between these trendlines over 1-3 months, narrowing into a diamond shape. The pattern should have four distinct points – the top, two symmetrical midpoint highs/lows, and the bottom tip. Avoid trading irregular diamonds that lack clearly defined upper and lower trendlines.
Confirm the Pattern
While trading diamond patterns, look for increasing volume on the last portion of the pattern, signaling a potential breakout. Use indicators like moving averages, MACD, or RSI to confirm the prior trend is weakening. Check for candlestick patterns like dojis or pin bars that signal indecision and reversal. Reference other technical factors like Fibonacci levels and support/resistance for additional confirmation. Avoid trading shallow diamonds without clearly defined support and resistance levels.
Plan the Trade
Whenever a diamond pattern breaks out, measure the height from the bottom tip to the center of the diamond to estimate the potential price target. Identify upside targets based on historical resistance, Fibonacci extensions, and chart patterns. Set stop losses below the lower trendline or swing lows to limit risk. Determine position sizing based on the height of the pattern and risk tolerance. Set alerts above the upper trendline and at key support levels to monitor the breakout.
Execute the Trade
Initiate the trade on a confirmed break above the upper trendline with expanding volume using a market order to ensure entry or placing a limit order 1-2% above. Consider entering on the retest of the broken trendline after the initial breakout. Activate a stop loss 3-5% below the lower trendline or layer in multiple stops to manage risk on the trade.
Manage the Trade
Once a diamond pattern breaks out, the trail stops below key support levels or moving averages as the trade becomes profitable. Take partial profits at the minimum 1:1 measured target and move stops to breakeven. Consider utilizing trailing stops or scaling out around Fibonacci extension levels. Stick to your trading plan, and do not let emotions influence your trading decisions when managing these trades.
Utilizing proper analysis, planning, execution, and management will lead to improved trading performance when trading diamond chart patterns. Follow these guidelines to effectively capitalize on diamond trading opportunities.
What is the Significance of Diamond Chart Pattern for Technical Analysis?
The significance of the diamond chart pattern for technical analysis is that it signals consolidating price action between trendlines that leads to a potential breakout and reversal of the larger trend. The significance is due to its predictive abilities, versatility, ease of identification, and incorporation into trading strategies.
The diamond stands out due to its clear signaling of an impending trend reversal once completed. The pattern reflects a balance between buyers and sellers during an extended consolidation period. The eventual breakout from the tightening formation indicates one side has overpowered the other, and a new trend will emerge. Traders capitalize on these high-probability reversal signals. Diamonds form in any liquid market and on any timeframe, whether on a 1-minute chart or monthly.
Technical analysis reveals that the diamond pattern is universally applicable, making it a valuable tool for traders. Diamonds appear in forex, stock indices, commodities, and cryptocurrencies through technical analysis, demonstrating the pattern’s effectiveness across various asset classes. The pattern works on leading individual stocks across sectors, and traders observing multiple timeframes identify additional opportunities through the lens of technical analysis. The diamond’s versatility across markets and timeframes significantly expands its usefulness, underscoring the importance of technical analysis in identifying trading opportunities.
How Reliable is the Diamond Chart Pattern as a Trading Indicator?
The reliability of the diamond chart pattern as a trading indicator depends on strict adherence to predefined entry, stop loss, and take profit criteria based on a confluence of factors like defined support/resistance, volume, and other technical indicators. The diamond is a complex, multi-legged pattern that has very specific entry, exit, and stop-loss rules. The pattern begins with a sharp move in one direction, followed by a correction. This creates the first two points of the pattern, which look similar to a head and shoulders pattern.
The next two points create the diamond shape – the pattern retraces back to the original correction point before breaking out again in the direction of the original movie. Traders must identify all four points of the diamond accurately, paying close attention to the distinctive volume and reversal clues at each point. It greatly reduces the accuracy of the overall pattern if any part of the pattern is mislabeled. Compared to simpler patterns like double bottoms or head and shoulders, the diamond has more room for error in its interpretation.
What are some common mistakes traders make when interpreting the diamond chart pattern?
Some common mistakes of traders interpreting the diamond chart pattern are misidentifying the pattern, mistiming entries, and exits, trading it in unsuitable market conditions, lacking trading rules, and psychological errors. Mastering both the technical structure of diamonds and their strategic implementation is critical.
Misidentifying the Pattern
Some common technical mistakes include confusing diamonds with other similar chart patterns like double tops, head and shoulders, and wedges if the structure is not carefully labeled. Accurately identifying all four reversal points is critical – missing one leads to incorrect analysis. Traders also must confirm reversals with spiking volume, as lack of volume suggests a false pattern. Finally, failure to use supporting indicators like moving averages to confirm the potential reversal points undermines analysis. Properly identifying the specific technical structure of the diamond and confirming with volume and other indicators is key.
Incorrect Entry and Exit
Common execution errors include entering trades too early before the pattern fully forms or too late after the breakout. Traders must balance timely entry with adequate confirmation. Premature or delayed exits also undermine success – exiting profitable trades too soon fails to maximize gains, while loose exit discipline turns winners into losers. Finally, sloppy stop loss placement, like stops too tight or too loose, leads to premature exit or uncontrolled risk. Managing entries and exits requires balancing confirmation, timeliness, discipline, and prudent risk control. Mastering trade execution within a strategic plan is essential to maximizing the potential of chart patterns.
Trading in the Wrong Market Conditions
Trading diamond patterns in unfavorable market conditions undermines their efficacy. For example, trading in low liquidity stocks where thin volume exaggerates volatility and widens bid-ask spreads, leading to slippage. Going against the major trend by trading long diamonds in downtrends or short in uptrends lowers probability. Increased market volatility itself reduces the reliability of technical analysis like chart patterns. Finally, trading around major news events allows fundamentals to quickly negate technical signals. Traders must apply diamond patterns in suitable market conditions to maximize reliability and profitability.
Lack of Trading Rules
Not having a written trading plan with defined rules for entries, exits, and stop loss placement means decisions become subjective and emotional. Inconsistently applying a trading plan by straying from predefined rules undermines the efficacy of any pattern. Ill-defined risk management without pre-planned stops based on volatility and chart structure leads to uncontrolled risk. Improper trade sizing with positions too small, reducing returns or too large, and exaggerating risk are also common. Strict trading rules, prudent risk management, and size discipline are essential to successfully implement high-probability diamond signals.
Trader Psychology Errors
Psychological errors like seeing diamonds where none exist, confirmation bias to only accept signals that match the prediction, overtrading by aggressively taking every pattern signal, revenge trading to recover previous losses, refusal to admit wrong and exit failed trades quickly, and overconfidence after winning streaks undermine even reliable patterns. Traders imagine diamonds in meaningless price action or become arrogant, believing the pattern is flawless. Overtrading adds excessive risk and fees. Revenge and refusal to exit failed trades increase losses. Maintaining objectivity, prudent risk-taking, and actively avoiding psychological biases are vital to successfully trading high-probability diamond patterns.
The common mistakes outlined above each undermine even a reliable chart pattern like the diamond. Avoiding these errors separates those who achieve lasting trading success from those who fail.
What are the Potential Benefits of the Diamond Chart Pattern Used as a Trading Decision?
Potential benefits of using the diamond chart pattern as a trading decision tool are early reversal signals, clear entry and stop loss points, predefined risk/reward, volume confirmation, trend combination, spotting manipulation, objectivity, and time efficiency.
Early reversal signals: One of the main benefits is that diamond patterns alert traders to potential trend reversals relatively early. The converging price action towards the apex gives advance warning of a likely turn ahead. This provides more time to plan trades before confirmation.
Clear entry points: Entries are clearly shown by the breakout direction after the diamond formation. A break above resistance signals long trades while breaking support alerts short trades. Removes confusion about where to enter.
Stop loss placement: The pattern provides logical areas to place stop losses below support or above resistance. This allows for defining risk on trades entered based on diamonds.
Profit-taking guidance: Price objectives are based on measuring the vertical height of the diamond pattern. The height projected from the breakout gives guidance for profit-taking.
Trading indecision: The converging price action marks periods of trading indecision and consolidation. Well-defined diamonds have reliable apex breakouts when indecision resolves.
Predefined risk/reward: Since the approximate height and width of the pattern are known, it allows establishing predefined risk/reward ratios on trades, ideally at 2:1 or higher.
Works across timeframes: Diamonds form on charts across multiple timeframes, allowing the application for swing, day, or scalp trading. Shorter diamonds provide lower-risk setups.
Volume confirmation: Volume tends to expand on confirmation of an apex breakout. This volume confirmation adds robustness to the diamond signal.
Combination with trends: Trade in the direction of the larger trend by looking for bullish diamonds in uptrends and bearish diamonds in downtrends.
Spotting market manipulation: Reversals often happen around diamond apex points due to market manipulation attempts to run stops. Diamonds help expose this manipulation.
Versatile usage: Beyond reversals, diamonds also potentially signal continuation patterns in a trend after a pullback or pause. This expands the use cases.
Objectivity: Defined entry, stop loss, and profit target rules based on diamond height and breakouts remove subjectivity in trade planning.
Time efficiency: The easily identifiable shape allows for quick detection on charts, aiding in rapid trading decisions without overcomplicating analysis.
Diamond chart patterns give traders an objective way to identify potential turning points in a stock’s price action. By combining diamond signals with sound risk management practices, traders benefit from high-probability setups.
What are the Potential Risks of Diamond Chart Patterns Used as a Trading Decision?
Potential risks of using diamond chart patterns as trading decisions are false signals, failed breakouts, subjectivity, lack of confirmation, rarity, whipsaws, cluster risk, and volatility. They are given below.
False Signals: One of the biggest risks is that the diamond pattern fails to result in an actual reversal as expected. The pattern signals an impending trend change, but the price action always shifts and invalidates the signal. This results in a false signal and a wrong trading decision. Strict criteria around volume, breakouts, and other confirmations should be applied to avoid false signals.
Failed Breakouts: Many traders rely on the breakout direction of diamond patterns to enter trades. However, breakouts quickly fail, and the price action whipsaws back in the opposite direction. Planning stop losses and not risking too much capital on breakouts helps manage failed breakouts.
Subjectivity: There is subjectivity in identifying diamond patterns, apex points, trend lines, and breakout signals. Traders often see different patterns in the same chart, leading to conflicting trade signals and interpretation biases. Using clear, objective criteria helps overcome subjectivity.
Lack of Confirmation: Diamonds provide early reversal signals but still require confirmation from other indicators like volume, candlestick patterns, moving averages, etc. Acting purely on an unconfirmed diamond signal and lack of convergence increases risk. Traders should wait for confirmation signs before acting.
Rarity: Ideal textbook diamond patterns are relatively uncommon. The strict criteria around trendlines, volume, apex formation, etc, mean recognizable patterns don’t form that frequently. Basing too many trades off diamond signals leads to limited trading opportunities.
Whipsaws: Prices swing back and forth across support and resistance levels multiple times, triggering premature entry and exit signals. This whipsawing price action around a diamond’s apex and breakout points leads to successive stopped-out trades.
Cluster Risk: The resulting collective trader actions actually end up invalidating the signal when a certain pattern becomes widely followed. It artificially inflates prices and causes a reversal if too many traders buy the breakout together.
Volatility Risk: Diamond breakouts are often planned around major news events or data releases, which bring added volatility risks. Traders get caught on the wrong side of volatile breakout moves.
Practicing robust risk management on every trade entered using diamond signals is also essential. Diamond patterns are a helpful addition to a trader’s arsenal of analysis tools when used prudently.
Can I Use the Diamond Chart Pattern in Other Financial Markets?
Yes, the diamond chart pattern is applied to other financial markets besides stocks, such as forex and commodities. The diamond pattern appears frequently in forex charts, especially for major currency pairs like EUR/USD. It signals a period of consolidation and indecision in the currency market before a potential breakout. Forex traders look for diamond top or bottom patterns to identify turning points where a currency reverses its larger uptrend or downtrend. The pattern’s development reflects shifting momentum and power struggle between buyers and sellers in the currency pair.
Is the Diamond Chart Pattern Bearish?
No, the diamond chart pattern is not inherently bearish in the context of stock market technical analysis. The diamond pattern is a neutral chart formation that develops when the price of a stock consolidates between two parallel trend lines that connect the high and low points. This pattern resembles a diamond shape on the chart.
The diamond pattern indicates a period of indecision and consolidation, as neither buyers nor sellers are in control. The breakout from the diamond pattern is more significant than the pattern itself in determining future direction. An upside breakout with strong volume indicates buying momentum is likely to push the stock higher. This would be considered a bullish breakout. Conversely, a downside breakout signals potential bearish momentum ahead.
Does Diamond Chart Pattern Occur Near Market Tops?
Yes, diamond chart patterns occur near market tops in the stock market. The diamond pattern is a reversal pattern that is usually seen at market turning points. It signals that the uptrend is losing momentum and is ready to reverse into a downtrend when a diamond top pattern forms after an uptrend.
Does Diamond Chart Pattern Signals a Reversal of an Uptrend?
Yes, the diamond chart pattern does signal a reversal of an uptrend in the context of stock market technical analysis. The diamond pattern forms when the price of a stock consolidates after a strong uptrend, forming higher highs and lower lows that contract into a diamond shape. The pattern reflects hesitation and indecision among buyers after a strong advance. Typically, the uptrend will show signs of weakness before forming the diamond top pattern.
Do Technicians Suggest Calculating the Potential Move After the Neckline of the Diamond Chart Pattern is Broken?
Yes, technical analysts do suggest calculating the potential price move after the neckline of a diamond chart pattern breaks. This is especially common in the context of analyzing stocks and forecasting future price movements. The diamond pattern forms when the price consolidates into a tight range, with the upper and lower boundaries forming a diamond shape. Once the pattern is completed, technicians look for a breakout above or below the neckline of the diamond. This signals the start of a new trend in the direction of the breakout.
What is the difference between Diamond Patterns and Gaps?
The diamond pattern and gaps are two different chart patterns used in the technical analysis of stocks. The diamond pattern is a reversal pattern that is formed when the price consolidates into a narrowing range after an uptrend or downtrend. It resembles a diamond shape on the chart. It signals a potential trend reversal when the pattern is complete. Key features of the diamond pattern include the formation of higher lows and lower highs as the range narrows, increased volume on the breakout, and a breakout above or below the pattern, which signals the new trend direction.
Gaps, on the other hand, are empty spaces on a chart where no trading occurs. They represent an area where there are no buyers or sellers. Gaps form on daily, weekly, or intraday charts. They signal a potential continuation or reversal of the prevailing trend. Key types of gaps include breakaway, runaway, exhaustion, and common gaps. Gaps show substantial price movement, and signal increased momentum and volatility. While the diamond pattern is a consolidation formation, gaps represent a sharp break in price with no overlap between the high and low of two consecutive candles.


Share


No Comments Yet