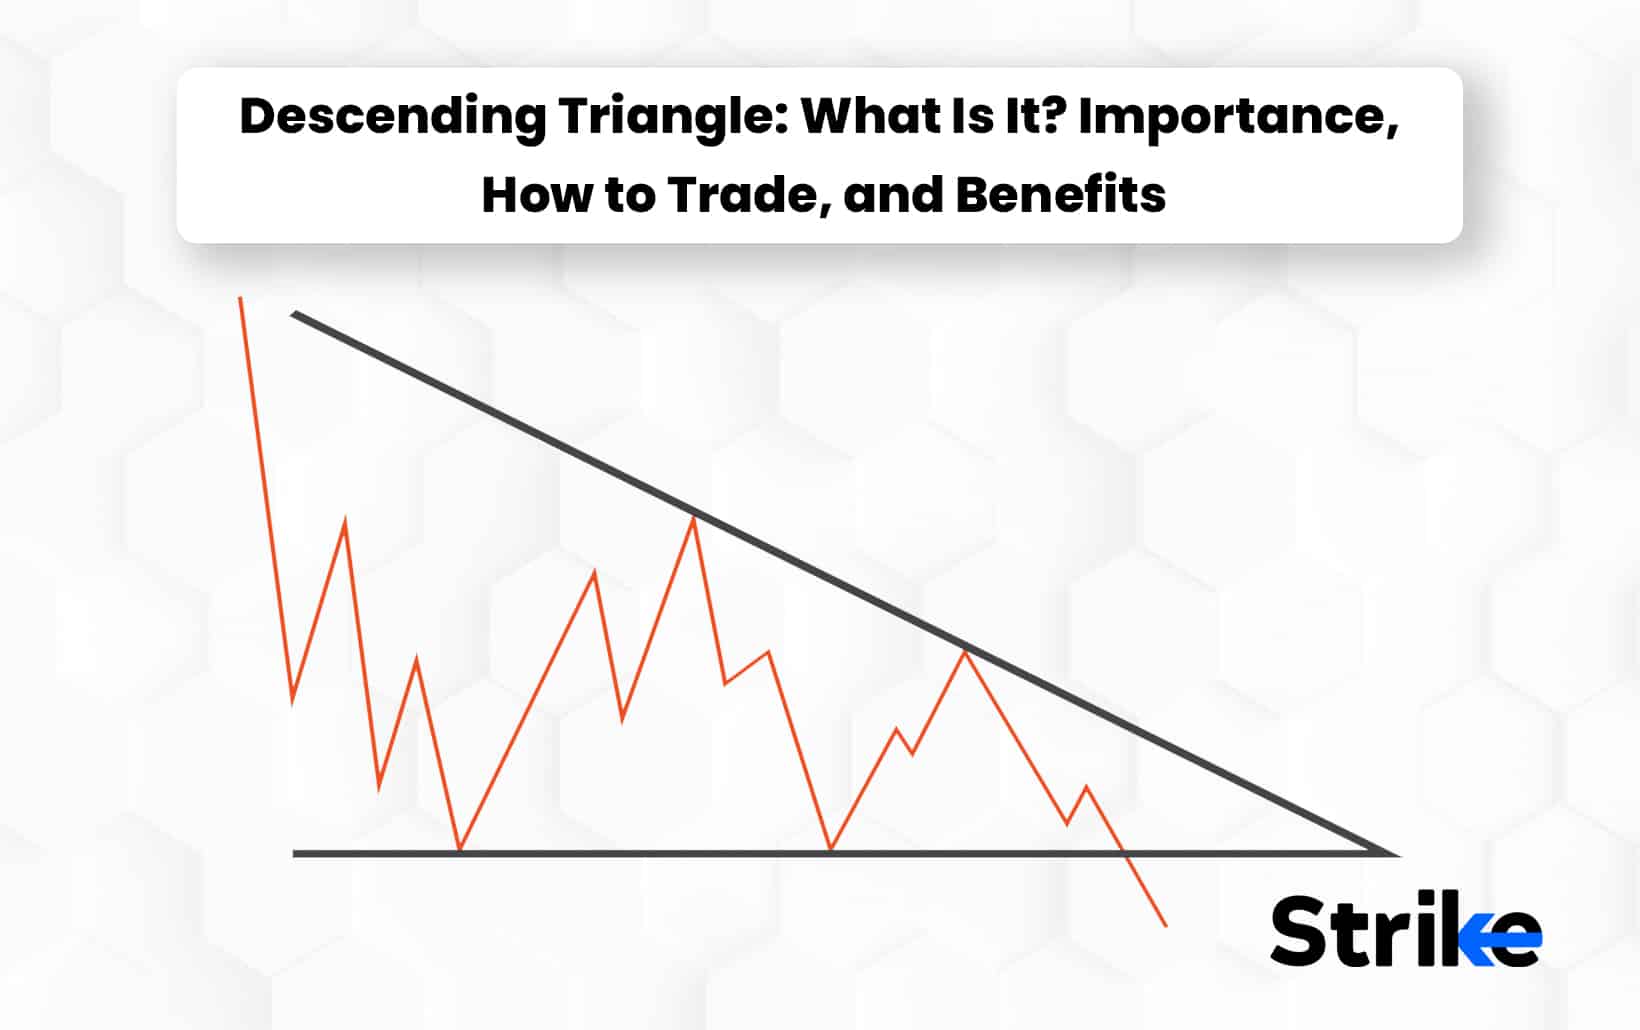
A descending triangle pattern is one of the most prominent continuation patterns that arise in the mid-trend. A descending triangle pattern is also known as a falling triangle pattern. A flat lower trendline serves as support and a falling upper trendline makes up the descending triangle, a bearish pattern. This pattern suggests that sellers are being more aggressive than buyers, as the price keeps hitting lower highs. The pattern completes itself when the price breaks out of the triangle toward the general trend.
A regular descending triangle pattern is a continuation pattern that is generally considered as a bearish chart pattern with an established downtrend. A descending triangle pattern can also be bullish and have a breakout in the opposite direction; this is referred to as a descending reversal chart pattern. The pattern is also known as a right-angle triangle because of its shape.
Traders often start a short position after a high volume breakdown from lower trend line support in a descending triangle chart pattern.
Descending triangles have the benefit of being able to appear at any time. The triangle’s existence depends on the length of the price chart. For instance, the triangle is present on a daily chart for more than a week or even for several months, although it is often seen on an hourly chart for only a few days.
What does a Descending Triangle Pattern in Technical Analysis indicate?
A Descending Triangle is a bearish configuration that appears in both uptrends and downtrends. The chart pattern indicates a trend reversal when it appears in an uptrend and a trend continuation when it appears in a downtrend. The continuation signal is considered more important although traders use both signals to forecast a trend’s direction.
Two trend lines make up the triangle formation in technical analysis chart. A falling upper line that crosses descending swing highs and a horizontal lower line connects swing lows. The formation takes place when the market is consolidating.

The psychology underlying the pattern is that the sellers attempt to drive the price down but are unable because of a high support level, hence the price rises which means the price oscillates inside of a triangle formed by the two trendlines. The sellers, however, remain active, as shown by lower highs. The theory is that despite the short-term stability, sellers still force the price below the support level due to their strength.
How Does a Descending Triangle Pattern Work?
The descending triangle chart pattern enables traders to calculate the distance from the pattern’s highest point, which serves as its starting point, to the flat support line. This kind of technical analysis recognises a downward trend that eventually overcomes the resistance levels, causing the price action to fall. Usually, buyers push the prices higher when there is a price drop. The descending triangle, on the contrary, shows when there isn’t much buying pressure. Here, sellers start selling for even less, indicating a string of lower highs. A breakdown generally appears when the volume is high and the move that follows is fast.
Technical traders take a bear position following a high-volume break in order to trade the pattern. The price target is typically determined by subtracting the entry point from the vertical distance between the lines when the breakdown occurs. Traders must spot obvious breakdowns and stay away from misleading signals if they want to profit from a falling triangle. They must also take into account the possibility that, in the absence of breaks, the price test the upper resistance before descending once more to the lower support line.
How Important Descending Triangle Pattern in Technical Analysis?
The Descending Triangle chart pattern is one of the most important and popular chart patterns because it’s simple to understand and exhibits the demand for, or lack thereof in, the stock. Traders generate above-average returns in a short amount of time using this bearish pattern. The pattern serves as confirmation for a trading strategy or as a signal for traders to enter or exit a trade. The pattern can serve as confirmation for a trading strategy or as a signal for traders to initiate or leave a deal. This pattern is used by traders to determine possible short-selling opportunities and establish entry and exit points for transactions.
How does the Descending Triangle Pattern form?
The Descending Triangle is formed by two trendlines; one for high prices and one for low prices. The triangle’s lower trendline is a horizontal trendline, while the triangle’s upper trendline is a descending trendline.

The result is a right triangle with a hypotenuse that gradually descends. Price keeps hitting resistance at a specific level as it declines and begins to recover some of its losses. A series of lower highs is produced because the subsequent retracement is shorter than previous retracements. The lower highs show that more sellers are progressively entering the market due to their willingness to accept a lower price to establish a short position. This causes selling pressure as the price integrates and moves towards the apex.
Prices on the upper trendline continue to fall, resulting in a triangular formation that is getting smaller until the lower trendline’s level of support is broken. Traders should be on the lookout for a potential breakout through the support level as the price is consolidating with a bearish bias.
The asset’s price has been trending downward over time, and when the level of support is broken, it turns into a level of resistance.
What are the key features of a Descending Triangle Pattern in Technical Analysis?
A Descending Triangle Pattern in technical analysis has 4 key features. These 4 key features are an ongoing downtrend, a descending upper trendline, a horizontal lower trendline, and a continuation of the downtrend after the breakout.
- There must be an ongoing downtrend before the descending triangle pattern appears on the chart.
- A descending upper trendline are created by joining the higher points indicating that sellers are driving the prices lower.
- The lower horizontal trendline serves as support as prices get close to this level until the breakout happens.
- The downward trend continues following the breakout and is seen below the lower trendline.
These key features of the descending triangle chart pattern help traders to identify the pattern in a price chart.
How often does the Descending Triangle Pattern occur?
The descending triangle pattern often occurs when a security’s price declines but then rebounds off the supporting line and rises. A descending triangle is a popular continuation pattern that emerges in a downtrend, just as an ascending triangle frequently forms in an overall uptrend.
The pattern is typically interpreted as an indication of a potential market reversal and trend change if it occurs during a long-term uptrend.
How long does a Descending Triangle Pattern last?
A descending triangle pattern will take around 28 days to establish and will not last for more than 90 days similar to an ascending triangle pattern. Descending Triangle patterns are most frequently used on daily charts and are typically interpreted over a few months. Strong triangular patterns, for instance, on a daily chart call for a prior trend that is at least a few months old and often develops for several months before a breakout takes place.
What is the accuracy rate of Descending Triangle Pattern?
The descending triangle pattern is 79% successful in a downtrend and results in an average price decline of 16%. There is an 87% success rate for an upward breakout of an existing uptrend when a descending triangle stock chart pattern is present. Price increases by an average of 38% when the price breaks through the resistance.
How effective is a Descending Triangle Pattern?
The descending triangle pattern is thought to be one of the most trustworthy and effective trading patterns as its post-pattern implications happen more quickly than those of other patterns.
The average price increase following the confirmation of a descending triangle pattern on a break of either the support or resistance line on higher volume is +38%, according to Tom Bulkowski’s research of over twenty years.
Traders consider opening a long or short position once the falling triangle pattern is verified, depending on the direction of the price movement.
How to Trade with a Descending Triangle Pattern in the Stock Market?
Traders generally follow 4 major steps to trade with a Descending Triangle chart pattern in the stock market.

The first step is to identify the chart pattern, the second step is to find the required trendlines, the third step is to monitor the breakout, and finally open a position following the breakout.
- The pattern generally appears at the end of the bearish rally when the price grows stronger before making another move.
- The second step is to find a trend line with lower highs and a lower trend line support level, which together form a triangle.
- You will be watching for the breakout to take place, which denotes the trend is gaining momentum, after recognising the pattern. The pattern is established when the breakout occurs and the bearish trend continues.
- A trader will, therefore, open a position following the breakout with a stop loss set at the peak of the most recent price swing inside the triangle.
Traders recognize the price is in a downtrend, draw the lower horizontal line after at least two unsuccessful attempts to break the support level. Then recognize a trend line that is bearish and has at least two lower highs, wait for the breakout before placing a sell order if the first candle following the breakout closes below the lower line (to confirm the breakout). Lastly, place a stop loss order above the lower horizontal support line while trading in stock market.
What Are Some Common Trading Strategies Used with Descending Triangle Patterns?
There are 4 common trading strategies used with descending triangle patterns which are descending triangles with Heikin Ashi charts, descending triangle with moving averages,
the descending triangle reversal topping pattern, and descending triangle reversal pattern at the bottom.
Descending Triangle with Heikin Ashi Charts
Traders create a powerful but easy trading technique using descending triangle patterns and Heikin Ashi charts. Heikin Ashi charts’ ability to portray the trend is one of their key distinguishing features. Most traders frequently have trouble spotting the trend. They rely on Heikin Ashi charts to clear up this confusion as these charts are visually different from other chart types.
Traders using this approach simply have to wait for the falling triangle pattern to appear. The next stage after the pattern appears is for the bullish trend to resume. The Heikin Ashi candlesticks will become bullish before the breakout, in the majority of cases. This is utilized as an initial signal to set up long positions in expectation of a breakout.
Descending Triangle with Moving Averages
Traders and intraday speculators can also mix price action strategies, chart patterns, and technical indicators. One of the most traditional and straightforward technical indicators to use is the moving average.
The descending triangle pattern is used in this trading method to predict probable breakouts. The purpose of the moving average indicators is to serve as a signal to start a trade.
Using volumes is not necessary while applying this trading strategy. Also, keep in mind that the exponential moving averages(EMAs) does not always give off a bullish signal prior to the breakout. The best signal to trade is when you receive bullish EMAs and a breakout.
The Descending Triangle Reversal Topping Pattern
You can spot the descending triangle reversal pattern at the peak of a rally. This pattern starts to take shape as volume decreases and the stock fails to reach new highs. The pattern shows that the bullish momentum has fallen. A horizontal price support level forms at the same time following the price action.
We should expect a potential downward breakout if the price repeatedly bounces off the support level while making lower highs. The price must move a minimum amount before the breakout from the initial high. A shorter distance is anticipated after the price breaks out below the support level. Trading is sometimes quite simple if you recognize the descending triangle reversal pattern before the breakout.
Descending Triangle Reversal Pattern at Bottom
The descending triangle reversal pattern at the bottom of a downtrend is the exact opposite of a distribution event. The price action in this particular case stops moving forward at the end of a downward trend. A horizontal support level indicates the price bottoms. Multiple upward attempts result in lower highs. Price action then eventually breaks out to the upside from the bottom of the descending triangle reversal pattern. You can trade long positions with this setup in contrast to the earlier method. Traders trade the pattern in anticipation of a probable upside breakout.
How Can Traders Confirm the Validity of a Descending Triangle Pattern?
Technicians can start by examining the structure of the pattern itself. The descending triangle forms through a flat support line along the bottom and a descending resistance line converging downwards. This shape reflects decreasing bullish momentum that may lead to an eventual bearish breakdown.
Looking at the volume trends also provides clues. Volume should diminish and dry up as the pattern matures towards the apex. Declining volume points to waning enthusiasm from buyers as the price range tightens.
Previous support and resistance levels can also confirm pattern validity. The key lines that make up the triangle should align with former price points that acted as support and resistance on prior swings and cycles.
Breakdown confirmation remains essential for descending triangles to signal reversals. The pattern is only considered validated when the price successfully penetrates support with an expansion of volume. This increase in volume provides evidence of genuine buying exhaustion.
Prudent technicians combine descending triangle signals with other indicators like oscillators to gauge momentum trends. Candlestick analysis also helps assess seller pressure building up within the formation. Proper risk management techniques, including stop losses and position sizing, remain critical when acting on triangle breakdowns.
How can traders detect trades with the Descending Triangle Pattern?
Traders can detect trades only after the descending triangle pattern is formed. Technical traders can aggressively drive the price of the asset lower once the breakdown happens and generate substantial returns in a short amount of time.
When is the best time frame to trade a Descending Triangle Pattern?
Descending triangles can occur on any timeframe, but hourly charts see them more frequently. Descending triangles are typically found on intraday charts, 5, 15, or 60-minute time frames. This makes the descending triangle an outstanding pattern for day traders.
A descending triangle pattern often takes weeks to produce, even on an hourly time scale. Traders should follow the stock over a medium-term timeframe on an hourly or daily chart and be ready to enter at any time to maximize possible profits.
How do Traders Measure Descending Triangle Patterns?
The descending triangle has a built-in measurement method that is used to analyze the pattern to determine possible take-profit levels. Traders can calculate the length of the descending triangle by measuring the angle between the pattern’s highest point and the flat support line. You can later reverse the same distance, starting from the breakout point and ending at the probable take-profit level.

The figure above demonstrates how to project a potential take-profit level by transferring the distance from A to B lower down, from C to D.
What is an Example of Descending Triangle Pattern Used in Trading?
The chart below demonstrates a good example of a descending triangle pattern on the USD/CAD pair.

The 1.3848 level provided essential support for the pair as you can see. There were not enough purchasers to drive the price higher as it ascended since it encountered some opposition. This pattern predicts a lower breakout for the pair as a result.
What are the Benefits of a Descending Triangle Pattern in Technical Analysis?
The descending triangle pattern has 5 main benefits in technical analysis. The pattern has a high success rate, is easy to identify, helps to reduce emotions from trading decisions, produces a clear target level and traders can trade within the triangle.
- The high certainty of a price move is the main advantage of trading falling triangles.
- Traders can simply determine and measure the risk/reward ratio of their trade.
- Descending triangles also assist in lowering the emotional component of trading decisions by establishing distinct entry and exit locations.
- The descending triangle produces a distinct target level based on the descending triangle’s maximum height.
- Trading within the triangle is an option given that the descending triangle is an intermediate-term pattern, but trend-following trades should be prioritized.
The descending triangle chart pattern is a helpful chart pattern as it provides distinct entry and exit points as well as a target level based on the pattern’s maximum height.
What are the Limitations of a Descending Triangle Pattern in Technical Analysis?
The descending triangle trading pattern has 3 main limitations. The pattern can provide false breakouts, sideways movement of prices and price does not break out in the direction predicted.
- False breakouts are always a possibility, and they have the power to cause the downtrend to reverse the pattern.
- There is a potential that price fluctuation will remain sideways for a long time or possibly increase.
- Trading a falling triangle has the greatest risk because the price might not move in the direction anticipated. Incorrect position-taking and insufficient stop-loss orders could lead to losses in this scenario.
Traders should perform careful analysis and risk management before making trading decisions based on the descending triangle pattern.
Is Descending Triangle Pattern Good?
A descending triangle pattern is neither good nor bad; it depends on the situation. The formation of a descending triangle often denotes the continuation of the downward trend, in a bear market and if it forms in an uptrend and signals a continuation, it indicates a bullish market. Traders should observe how the stock reacts when it reaches support and breaks out above or below the triangle, to decide whether to enter long or short positions.
Is Descending Triangle Pattern Bearish?
Yes, a descending triangle pattern is bearish. The pattern, however, in some situations can also be bullish. A descending triangle is bearish in a bear market amid a price downturn. The pattern serves as a continuation pattern in this instance. It can be bullish or bearish when created in an upswing during a bull market, leading to a trend reversal or continuation. Everything depends on the stock’s reaction when the price reaches support.
Is Descending Triangle Pattern Profitable?
Yes, Descending triangle pattern is considered profitable with an 87% success rate in an upward breakout in a bull market. Any trading pattern, including the descending triangle, however, does not guarantee success. The success of a descending triangle pattern will depend on a number of variables, including market circumstances, the trader’s talent and experience, risk management strategies, and the capacity to execute trades efficiently.
What is the difference between a Falling Wedge and a Descending Triangle Pattern?
| FALLING WEDGE | DESCENDING TRIANGLE |
| A falling wedge consists of a downward-sloping support level and a downward-sloping resistance level that converge towards one another to generate a bullish pattern. Traders anticipate a price break above the resistance level as the falling wedge is a bullish reversal pattern. The volume declines as a falling wedge pattern develops, which signals a potential bullish reversal. This pattern appears over shorter timeframes. | Descending triangle is a bearish pattern made up of a declining resistance level and a horizontal support level. Traders anticipate a price decline below the support level as this pattern is a bearish reversal pattern. Traders anticipate a descending triangle breakout on high volume to confirm the pattern. This pattern appears over longer timeframes. |
The key difference between these two patterns lies in their shape, breakout direction, and implications. Falling wedges are considered bullish and often indicate a potential trend reversal to the upside, while descending triangles are bearish and suggest a potential continuation of the existing downtrend. Traders use these patterns, along with other technical indicators, to make informed decisions about their trading strategies.
Share


No Comments Yet