


A bullish spinning top is a candlestick pattern that occurs when the closing price is higher than the opening price. The bullish spinning top has a Doji-like smaller real body which indicates that the opening and the closing price of the stock are more or less similar. Bullish spinning top has longer wicks suggesting that the highest and lowest price of the day has a significant difference between them.
One advantage of the bullish spinning top candlestick pattern is that it can provide traders with an early indication of a potential trend reversal in a downtrend. This can allow traders to enter a long position early in the uptrend, potentially maximizing profits. One drawback of the bullish spinning top is that it can also produce a false signal. The pattern is not always be followed by a significant uptrend, leading to a potential loss for traders.
What is a Bullish Spinning Top?
A bullish spinning top is a type of candlestick pattern that is formed when the opening and closing prices of a stock are almost the same, but there is a significant movement in the stock’s price during the trading period. The pattern usually has a long upper shadow and a small lower shadow. See the image below.

The long upper shadow and lower shadow in the given image suggest that the market was highly volatile during the time period. The highest price point of the day and the lowest price point of the day are significantly distanced. The real body of the bullish spinning top is small suggesting that the opening and closing price of the day is almost similar. The body of a spinning top thus looks similar to that of a Doji. The closing price has to be slightly above the opening price (although almost similar) to call it a bullish spinning top.
What is the Indication Bullish Spinning Top?
The indication of a bullish spinning top is that the stock could be bottoming out and the price start to rise soon. The bullish spinning top usually appears after a long run of a bearish trend. The pattern suggests that the bear is reversing to a bull. The pattern is a sign of indecision in the market, and the bulls and bears are evenly matched. But the bulls start to take control soon, leading to a bullish trend in the market.
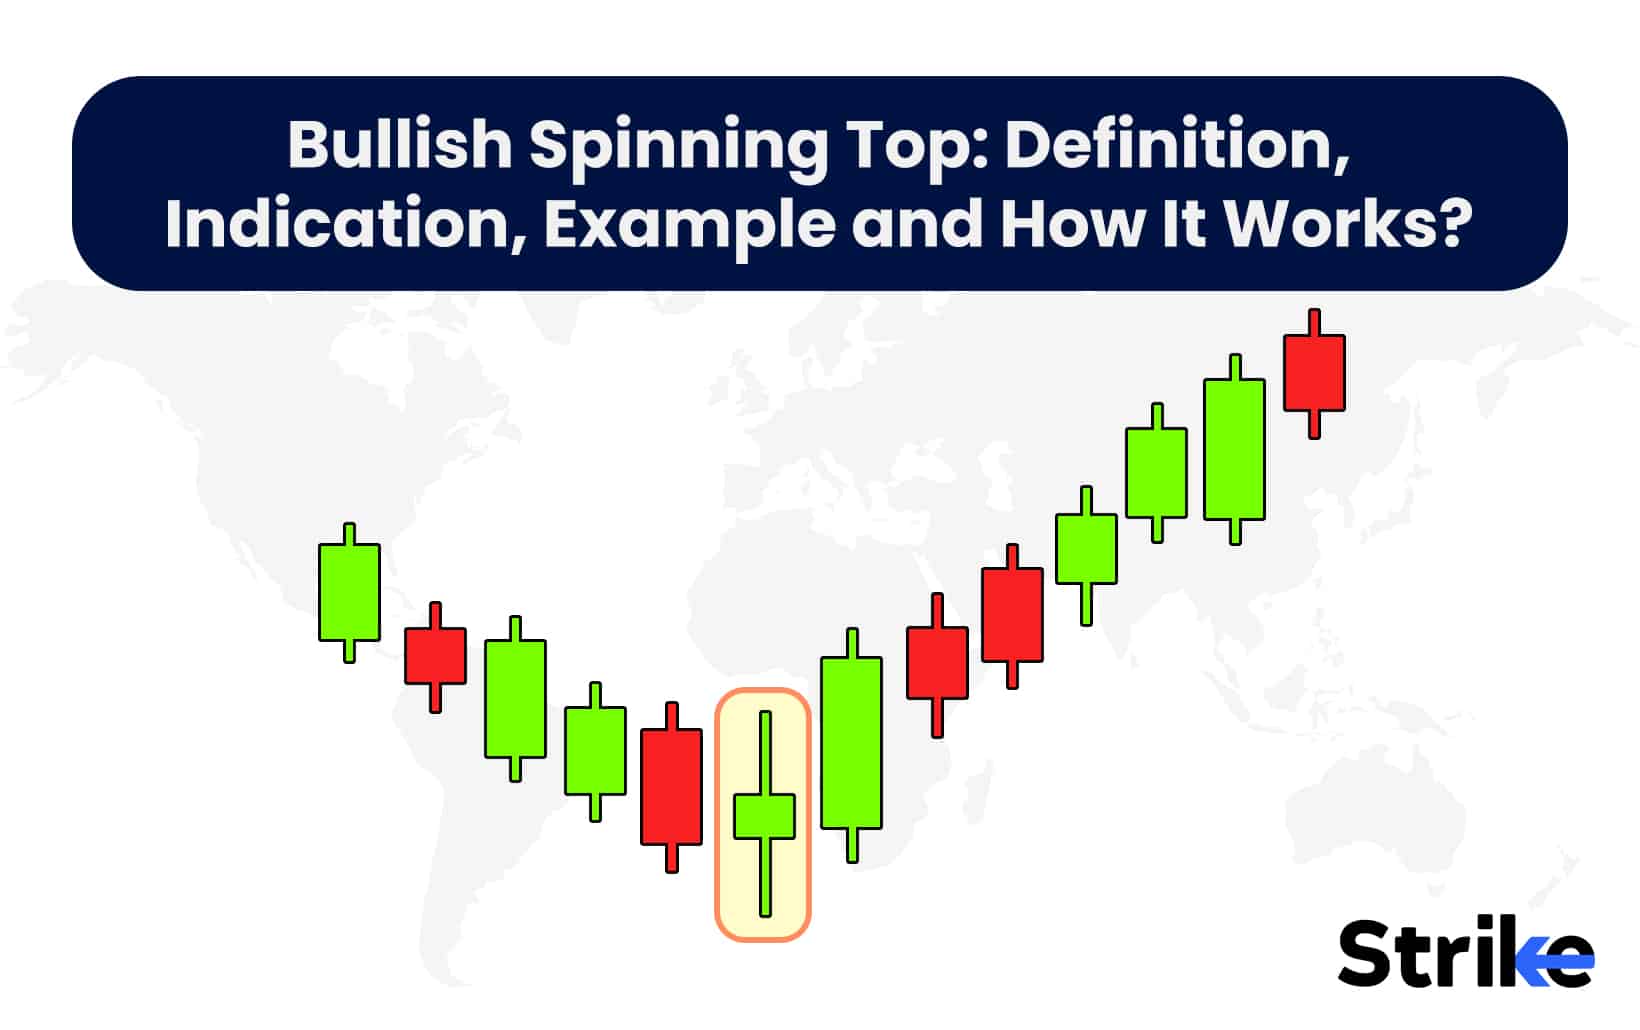
What is an Example of a Bullish Spinning Top?
An example of a bullish spinning top can be seen in the chart below.

The stock is bearish at the beginning of the chart. A bullish spinning top makes an appearance then. The market quickly turns bullish after the bullish spinning top. The appearance of the pattern could be used as a signal here.
Let us take an example to understand this better.
Company XYZ
Opening price – Rs.100
Closing price – Rs. 100.1
The highest price of the day- Rs. 110
The lowest price of the day – Rs.90.
There is a clear distance between the highest and lowest price of the day here, but the closing price is only slightly above the opening price.
The bullish spinning top indicates a possible reversal of the bearish trend and the beginning of a bullish trend. See the image below.

The bullish spinning top suggested the end of a bearish trend reversing to a bullish trend here.
What Does Bullish Mean?
A bullish trend occurs when stock prices are rising and investors are confident about the stock’s future. It is the inverse of a negative trend, in which stock values are declining and investors are pessimistic about the stock’s future. Typically, a 20% or greater shift from a recent peak or trough signals the start of a “official” bear or bull market.
It’s critical to understand market trends and trading tactics in order to maximise gains when trading in a bullish market. The first step is to recognise the trend by looking for a series of higher highs and higher lows in price movements, which indicates that the market is in an uptrend. You can select securities that are likely to gain from the bullish trend once the trend has been discovered, such as equities or ETFs that track the general market or specific sectors.
An example of a bullish market is when stocks began a bull market in March 2009, in the midst of the Great Recession, and it lasted until COVID-19 completely shut down the global economy in March 2020.
What is the History of the Bullish Term in Stocks?
The term bullish has been used in the stock market since the 18th century. The term originated from the way bulls attack their prey, with an upward thrust of their horns. This upward motion is similar to the upward motion of the stock prices in a bullish trend.
What are Other Types of Bullish Patterns?
There are other types of bullish patterns in the stock market, including the bullish engulfing pattern, the morning star pattern, and the hammer pattern. Below are details about each of these patterns.
- Bullish engulfing pattern

A bullish engulfing pattern is a chart pattern that can be used to identify a possible downtrend reversal. It happens when a small bearish candle is followed by a larger bullish candle that engulfs the previous candle completely. This pattern suggests that buyers have taken control of the market and are driving up prices. Traders who see a bullish engulfing pattern often interpret it as a signal to go long, as it suggests that the trend is reversing and prices may continue to rise.
- Morning star pattern

The morning star pattern is a bullish reversal pattern that can be used to identify potential downtrend reversals. It consists of three candles: a long bearish candle, a smaller candle with a small body that gaps lower, and a long bullish candle that closes above the first candle’s midpoint. This pattern indicates that selling pressure is easing and buyers are gaining control of the market, implying that a possible reversal is in the works. Traders who notice a morning star pattern frequently interpret it as a signal to go long.
- The hammer pattern

The hammer pattern is a bullish reversal pattern that can be used to identify potential downtrend trend reversals. It consists of a long lower shadow and a small real body near the candlestick’s top that resembles a hammer. This pattern indicates that after a period of selling pressure, buyers are entering the market and pushing prices higher. Traders who spot a hammer pattern often interpret it as a signal to go long, implying that a possible reversal is in the works.
- Thee white soldiers

The Three White Soldiers pattern is a bullish candlestick pattern that signals a potential trend reversal from bearish to bullish. The pattern consists of three consecutive long-bodied candlesticks with small or no shadows that open within the previous candle’s real body and close above its high. The pattern indicates a strong buying pressure that overwhelms the selling pressure and suggests that the price is likely to continue rising.
The Three White Soldiers pattern is more reliable when it appears after a prolonged downtrend and is confirmed by other technical indicators such as trend lines, moving averages, and oscillators. Traders can use the pattern as a signal to enter a long position or to exit a short position. However, it is important to confirm the pattern with other technical analysis tools and to use appropriate risk management strategies.
One potential drawback of the Three White Soldiers pattern is that it may also indicate an overbought market condition, where the price has risen too far too fast and is due for a correction. Traders should be cautious and use appropriate risk management strategies to avoid potential losses.
- Piercing pattern

The Piercing Pattern is a bullish candlestick pattern that signals a potential trend reversal from bearish to bullish. The pattern consists of two candlesticks, with the first candlestick being a long-bodied bearish candle and the second candlestick being a long-bodied bullish candle that opens below the low of the first candlestick and closes above its midpoint. The Piercing Pattern indicates a strong buying pressure that overwhelms the selling pressure and suggests that the price is likely to continue rising.
The pattern is more reliable when it appears after a prolonged downtrend and is confirmed by other technical indicators such as trend lines, moving averages, and oscillators. Traders use the Piercing Pattern as a signal to enter a long position or to exit a short position. However, as with all candlestick patterns, it is important to confirm the pattern with other technical analysis tools and to use appropriate risk management strategies. One potential drawback of the Piercing Pattern is that it may also indicate an overbought market condition, where the price has risen too far too fast and is due for a correction. Traders should be cautious and use appropriate risk management strategies to avoid potential losses.
The bullish patterns are best used with a technical indicator like RSI, MACD, Bollinger bands, etc.
What are the Best Bullish Indicators?
These indicators include moving averages, relative strength index (RSI), and Bollinger bands. Below are a few details about them.
- Moving averages
Moving averages are a popular technical analysis tool that traders use to identify market trends. Moving averages are calculated by averaging the price of an asset over a specified time period, with the 50-day, 100-day, and 200-day moving averages being the most common. The moving average is more sensitive to price fluctuations when the time period is shorter. Moving averages are used by traders to identify potential buy and sell signals, with crossovers between moving averages being a popular signal. Moving averages can also serve as levels of support and resistance, with prices frequently bouncing off of them.
- Relative strength index (RSI)
The Relative Strength Index (RSI) is a technical analysis tool that traders use to assess the strength of an asset’s price movement. RSI oscillates between 0 and 100 and is calculated by comparing an asset’s average gains and losses over a specified time period. RSI reaching 70 or higher indicates that the asset is overbought and may be due for a price correction. The RSI is considered oversold when it falls below 30, indicating that the asset is undervalued and due for a price increase.
- Bollinger bands
Bollinger Bands are a popular technical analysis tool used by traders to measure an asset’s volatility and potential price range. Bollinger bands are comprised of three lines: a simple moving average (typically 20 periods) and two standard deviation lines plotted above and below the moving average. The standard deviation lines expand and contract as volatility increases or decreases. It is often seen as an indication of an overbought or oversold condition when the asset’s price moves towards the upper or lower bands. Traders also use Bollinger Bands to identify potential breakouts or trend reversals.
- Cup and Handle pattern
The Cup and Handle pattern is a bullish continuation pattern that signals a potential trend continuation after a brief consolidation. The pattern is named after its resemblance to a cup and handle shape, with the cup being a U-shaped formation and the handle being a short consolidation period. The pattern typically consists of three parts: the initial cup formation, the handle formation, and the breakout. The cup formation is characterized by a gradual uptrend followed by a rounding bottom and a sharp upswing. The handle formation is a short consolidation period where the price oscillates within a narrow range. The breakout occurs when the price breaks above the resistance level formed by the handle formation and continues its uptrend.
- Ichimoku Cloud
Ichimoku Cloud is a technical analysis tool that helps traders identify potential trend reversals, support and resistance levels, and momentum shifts. It was developed by a Japanese journalist named Goichi Hosoda in the late 1930s and has gained popularity among traders worldwide. The Ichimoku Cloud consists of several lines that form a cloud-like structure on price charts. These lines include the Tenkan-sen, Kijun-sen, Chikou Span, Senkou Span A, and Senkou Span B. The cloud is formed by the area between Senkou Span A and Senkou Span B.
The Tenkan-sen and Kijun-sen lines are used to identify potential trend reversals and momentum shifts. The Chikou Span line is used to confirm these signals by plotting the current price 26 periods behind. The Senkou Span A and Senkou Span B lines form the cloud and are used to identify potential support and resistance levels. Traders use the Ichimoku Cloud to identify potential entry and exit points, as well as to set stop-loss and take-profit levels.
However, it is important to confirm signals with other technical analysis tools and to use appropriate risk management strategies. One potential drawback of the Ichimoku Cloud is that it may be difficult for beginners to understand and use effectively. Traders should take the time to learn the system and practice using it on historical data before applying it to live trading.
It is often a good idea to use multiple indicators at once to ensure the signal is true.
How Does the Bullish Spinning Top Works?
The bullish spinning top works by indicating a possible reversal of the bearish trend and the beginning of a bullish trend. The bullish spinning top forms when the asset’s price opens and closes at or near the same level, but with a long upper wick and a short lower wick. This pattern indicates that the price was under significant selling pressure during the trading period, but buyers were able to push it back up, indicating a potential shift in market sentiment. This pattern indicates that the market is indecisive and that bulls and bears are matched in strength. But a bullish trend in the market soon emerge if the bulls start to regain control.
How to Use Bullish Spinning Top in Trading?
Using a bullish spinning tops in trading is a five-step process. Below are the five steps.
- Look for the pattern in the charts of the stocks they are interested in.
- Use it as an indication of a possible bullish trend in the market If they see the pattern.
- Look for an entry point. The entry point is usually the moment the spinning top appears.
- Use stop loss just below the spinning top. This ensures you avoid losses if the strategy backfires.
- Monitor and exit the trade once you have gotten the best out of the trade. Use technical indicators and patterns to identify this point.
Make sure you use fundamental analysis too in this process. Fundamental analysis will help you identity which stocks to invest in primarily.
How Can I Identify a Bullish Spinning Top Pattern?
Traders should look for a candlestick with a small real body and a long upper shadow to identify a bullish spinning top pattern. Take a look at the image below.

The pattern should be preceded by a bearish trend and followed by a bullish trend. Traders use stock charting software to identify the pattern in the charts of the stocks they are interested in.
One important thing to note here is to not mistake a bullish spinning top for a bearish one. Look at the below comparison.

Bullish spinning tops appearing during uptrends are usually disregarded.
Is the Bullish Term Only Used for Candlestick Chart?
No, the bullish term is not only used for candlestick charts. Bullish is a term used in the stock market to describe a positive outlook on a particular stock on a candlestick chart or the market as a whole.
Is Bullish Spinning Top Better than Bearish Spinning Top?
It depends on the trading strategy of the trader. Both bullish and bearish spinning tops are used to indicate possible trends in the market. Traders should use both patterns in conjunction with other indicators to make informed trading decisions.
Does Bullish Mean Up Trend?
Yes, bullish means uptrend in stock market.
What is the Difference of Bullish Spinning Top from Bearish Spinning Top?
The difference between a bullish spinning top and a bearish spinning top is the direction of the trend they indicate. A bullish spinning top indicates a possible reversal of the bearish trend and the beginning of a bullish trend, while a bearish spinning top indicates a possible reversal of the bullish trend and the beginning of a bearish trend.


 Previous Article


 2026: Features, Pros vs Cons, Pricing, Reviews, Is It Worth It? 124")
 2026: Features, Pros vs Cons, Pricing, Reviews, Is It Worth It? 125")
 2026: Features, Pros vs Cons, Pricing, Reviews, Is It Worth It? 126")


 : Definition, Formula, calculation, Uses, Advantages Vs limitations 130")


No Comments Yet.