Broadening Top & Bottom Patterns: Definition, Formation, Identification, Trading Strategy


Broadening top and bottom patterns are chart patterns that help identify trend reversals primarily. Broadening top and bottom patterns start with orderly trending behavior that contracts the daily price swings. But over time, conviction starts to crack. Failed breakthroughs transform the neat uptrend or downtrend into a disorderly back-and-forth bout. Like a school of fish corralling into an ever-widening sphere under predatory threat, uncertainty stretches the price boundary more each session. Volume typically ebbs as neither bulls nor bears gain the firm upper hand.
This erratic phase must terminate in one direction. A conclusive break beyond the prior barrier signals which impulse – buying or selling – has worn down its rival. From there, follow-through momentum often propels values significantly further, as the previously pent-up pressures release in full.
For those attuned to the subtle shifts in market sentiment, broadening patterns offer tell-tale signs to profit from the transitions. By respecting the boundaries and waiting for clear confirmations, traders can structure high probability trades that capture sizeable rewards. Though whipsaws may occur along the way, patience and discipline ultimately win out.
What are Broadening Top & Bottom patterns?
Broadening Patterns such as broadening tops and bottoms are chart formations that signal potential trend reversals. Broadening Patterns have the key feature of expanding volatility shown by the violation of prior support and resistance levels, reflecting a tug-of-war between increasingly agitated bulls and bears. Volume generally declines as the pattern matures. These patterns represent indecision in the market until either buyers or sellers gain conviction, resulting in a breakout or breakdown from the broadening range.
Traders look to trade the eventual breakout or breakdown from the pattern. For broadening tops, traders employ bearish strategies on a breakdown, with stop losses limiting risk. For broadening bottoms, traders use bullish strategies on a breakout above resistance. Traders sometimes fade the expected move or trade within the broadening range based on overbought/oversold indicators. The minimum price target is the width of the broadening pattern.
How Broadening Top & Bottom Forms?
Bordering bottom forms as below.

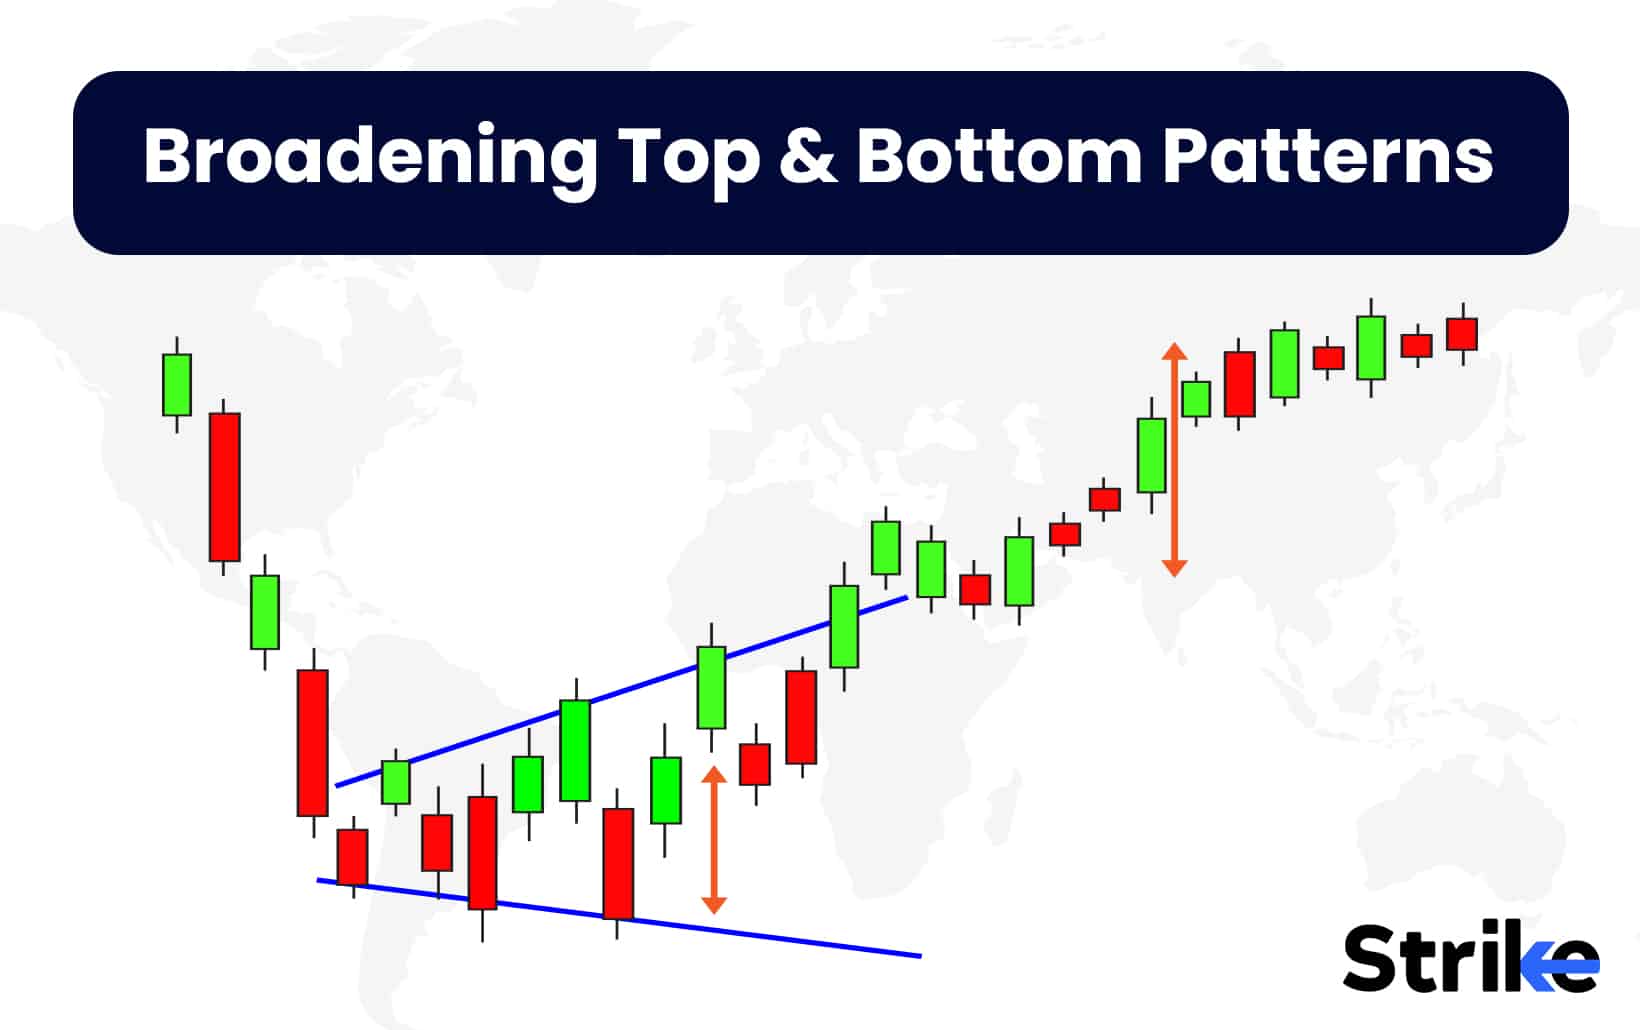
The Broadening Bottom pattern forms when the price makes lower lows but higher highs, creating two diverging trendlines. The upper trendline connects the swing highs and is more vertical, while the lower trendline connects the swing lows and is more horizontal. As the price continues in this broadening formation, the two trendlines converge. The pattern is completed when the price breaks out above the lower trendline on increased volume. This signals a potential trend reversal. The breakout point, where the price pierces the lower trendline, can be used to project a target price for the emerging uptrend.
Now let us look at bordering top.

The Broadening Top pattern forms when the price makes higher highs but lower lows, creating two diverging trendlines. The upper trendline connects the swing highs and is more horizontal, while the lower trendline connects the swing lows and is more vertical. As the price continues in this broadening formation, the two trendlines converge. The pattern is completed when the price breaks down below the upper trendline on increased volume.
This signals a potential trend reversal. The breakout point, where the price pierces the upper trendline, can be used to project a target price for the emerging downtrend. The pattern illustrates the transition from an uptrend to a potential new downtrend. The image depicts this pattern, with the upper and lower trendlines diverging and the breakout point showing a potential trend reversal.
How to identify Broadening Top & Bottom patterns?
To identify Broadening Top and Bottom patterns, look for a period of decreasing volatility and range contraction, followed by a failed breakout or breakdown that begins an expansion of the range with higher highs and lower lows. Three key features are the lack of a trend, reduced volume as the pattern progresses, and confirmation when price closes outside the broadening range.
To identify a Broadening Top, first look for a period where price is making a series of higher highs and higher lows in an uptrend. This shows decreasing volatility as the range contracts. Then look for a failed breakout where price spikes above the previous highs but quickly reverses back into the trading range. This failed breakout signifies the start of the broadening pattern, as volatility expands and price swings become wider. The broadening pattern will be made up of higher highs and lower lows as the range expands. Volume declines during this broadening period as buyers and sellers struggle to take control. The pattern completes when price breaks down below the previous swing low, confirming the reversal from an uptrend to a downtrend.
A Broadening Bottom is the inverse of this pattern. Look for a period of contracting volatility in a downtrend, where price is making lower highs and lower lows. This shows reduced volatility as the range narrows. Then look for a spike down that fails to break below the previous swing low. This failed breakdown marks the start of the Broadening Bottom, with volatility expanding as price swings widen again. The pattern consists of lower lows and higher highs that broaden the trading range. Volumes are muted as neither buyers or sellers gain control. The Broadening Bottom completes when price breaks out above the previous swing high, reversing the downtrend into an uptrend.
What happens after Broadening Top & Bottom patterns?
Broadening Top and Broadening Bottom patterns are usually followed by a significant price breakout, either upward or downward. Broadening Tops are followed by bearish breakouts and Broadening Bottoms see bullish breakouts. The widening structure builds energy that is later released with the breakout. This leads to an acceleration in the direction of the breakout as either buyers or sellers take control.
For Broadening Tops, the breakout usually occurs at the lower support boundary. The downside break signals that sellers have overcome buying pressure. Once support is penetrated decisively, sellers gain momentum and drive the price lower. The target for Broadening Top breakdowns is approximately the depth of the formation subtracted from the breakdown point.
How to trade Broadening Top & Bottom patterns?
Trading using Broadening Top and Bottom patterns is done by waiting for a clear breakout from the pattern and then entering in the direction of the breakout – go long after a Broadening Bottom breakout upwards or go short after a Broadening Top breakout downwards.
Look for a series of higher highs and lower lows that expand in range over time. The broadening pattern should take on a megaphone or broadening shape, with no distinct uptrend or downtrend. Volume increases during the formation. The larger the pattern, the more significant the anticipated trend change.
Broadening tops form after an uptrend, signalling the trend is losing momentum and reverses into a downtrend. Broadening bottoms form after a downtrend and signal a potential trend reversal to the upside. The key is to wait patiently for a confirmed breakout before entering a trade. A break above resistance signals a broadening bottom, while a break below support confirms a broadening top.
Place a stop-loss order just outside the pattern’s boundary to define risk. Set a profit target using a 1:1 risk-reward ratio once the entry is triggered. For broadening bottoms, buy on a close above resistance with a stop under the pattern low. For broadening tops, sell short on a close below support with a stop above the pattern high.
Trail the stop just below the swing high/low to lock in open profits, if the breakout quickly gains follow-through. However, close out the trade for a small loss, if the price stalls or reverses after the entry.
The expanding range leads to volatility, so use wider stops. The pattern needs time to play out, so give the trade room to work before exiting. Ride the move for as long as the trend remains intact.
Ideally, volume will expand as the pattern develops, reflecting increased trader participation. Volume should then spike on the breakout, confirming traders’ commitment to the new trend. Light breakout volume warns the move fails.
Look for other technical signs to improve timing and validation. Oscillators like RSI identify overbought or oversold conditions. Trend lines, moving averages, and previous support/resistance levels pinpoints optimal entry and stop areas. Candlestick signals, momentum divergences, and pattern analysis provide additional trade clues.
Patience is key when trading broadening patterns. Wait for a valid break before pulling the trigger. Let winning trades run but quickly cut losses if the breakout fails. Stick to the trading plan and predetermined risk/reward rules. Remain objective,rationalise emotions, and avoid overtrading if the market moves against the position.
How to confirm Broadening Top & Bottom pattern before trading?
Before trading in a Broadening Top or Bottom pattern, confirm it by waiting for a clear breakout from the pattern with an increase in volume. The breakout should exceed the previous peak or trough. Also look for expanding volume on the breakout for greater confirmation. First, examine the overall trend to ensure the pattern makes sense in the context of the prevailing trend. A broadening top should only form during a sustained uptrend, while a broadening bottom should take shape during a downtrend. Pay attention to the angle and slope of the trend lines that connect the highs and lows to delineate the broadening formation.
Next, volume needs to increase as the pattern progresses, especially on the breakout. High volume adds validity and signals increased interest as the stock transitions from its previous trend to a new trend. Lighter volume as the pattern forms often leads to false breaks, so watch for heavier turnover, especially on the breakout bar and confirmation day.
The length of the pattern also carries information. Longer-lasting broadening patterns that take weeks or months to form are more reliable than shorter patterns that form in just a few days or weeks. The longer the time frame, the more significant the trend change tends to be.
In addition, the breakout point is key for confirmation. A valid breakout should occur outside of the upper or lower trendline at the endpoint of the pattern. A break above resistance confirms a broadening bottom, while a break below support confirms a broadening top. The ideal breakout occurs on heavy volume, reflecting conviction among market participants.
Sometimes a false breakout occurs before the true breakout. Be wary of breakouts on low volume or marginal new highs/lows. Waiting for a close outside the pattern offers more confirmation than just an intraday peek outside trendline support or resistance.
How to set up a stop loss while trading Broadening Top & Bottom patterns?
Establish a stop loss order just below important support prices in case the pattern fails and the downtrend persists in order to reduce losses when trading equities displaying expanding top and bottom formations. The ideal stop loss placement while trading in Broadening Tops and Bottoms depends on whether you are entering a long or short trade. On a Broadening Top, which signals a downtrend is likely ahead, traders would look to enter short trades.
The initial stop loss should be placed just above the recent swing high that preceded the Broadening Top formation. This swing high represents an area of resistance, so a stop above that level allows for wiggle room in case the pattern fails, while still limiting risk on the trade.For example, traders place the initial stop loss at Rs.51 or Rs.51.50 when entering short trades, if a Broadening Top formed after a swing high at Rs.50. This gives the pattern room to potentially push higher before reversing lower. It invalidates the pattern and signals traders should exit shorts, if price breaks above the stop level.
On a Broadening Bottom, which signals an uptrend ahead, traders want to enter long positions. The initial stop loss should be placed just below the most recent swing low before the Broadening Bottom took shape. This swing low marks support, so the stop below it allows for leeway in case the pattern doesn’t play out, while controlling risk on long trades.
How to choose a profit target for Broadening Top & Bottom pattern trading?
The most straightforward approach is to target the opposite side of the Broadening formation from your entry point. For example, the initial target would be the lowest swing low on the other side of the pattern, if you short a Broadening Top at the breakdown point. The first target would be the highest swing high across the formation, if you go along a Broadening Bottom at the breakout point.
This technique aims to capture an amount equal to the full width of the Broadening price action. On a long trade, the idea is to ride the upside reversal for the same magnitude as the prior downtrend, setting a clear profit target. On a short trade, the goal is to capture a decline similar to the preceding upside move, ensuring a well-defined profit target.
Which timeframe is best for trading Broadening Top & Bottom patterns?
The daily chart is generally considered the best timeframe to trade broadening tops and bottoms. These patterns evolve slowly over time and the daily chart captures the full scope of the pattern formation, from the initial price contraction to the subsequent expansion. The wide range of price action is best visualised on the daily timeframe. Traders see the full progression of higher highs and lower lows that define a broadening pattern. The daily chart also smooths out intraday noise and makes the overall directionality clear.
How accurate are Broadening Top & Bottom patterns?
. According to a statistical study by Thomas Bulkowski in his seminal work Encyclopaedia of Chart Patterns, the accuracy of these patterns ranges from 65-75% when confirmed by a break of trendline support or resistance. Bulkowski analysed over 4,000 chart patterns of all types to compile performance statistics. For broadening tops, he found an accuracy rate of 65% when using the trendline break to signal trades. Broadening bottoms were slightly more reliable at 75% accuracy after confirmation. The performance aligns with the general notion that bottoms are easier to trade than tops. The wide range also leads to larger subsequent moves once support or resistance breaks.
What are the advantages of Broadening Top & Bottom pattern?
Broadening tops and bottoms’s biggest advantage is that it clearly signal an end to the current trend. The pattern shows that buyers and sellers are in disagreement and the trend is losing momentum. This allows traders to anticipate a potential trend reversal early and adjust their strategies accordingly. Since the pattern develops over time with expanding volatility, observant traders have ample warning that a shift in sentiment is underway.
These chart patterns also provide well-defined levels of support and resistance. The peaks and troughs formed throughout the pattern’s development act as clear floor and ceiling levels for the price. Traders use these levels to set stop losses or identify good entry and exit points. The most recent supports and resistances are typically the most relevant for trading the eventual breakout. In addition, the broadening formation represents a consolidation period where value becomes mispriced.
This presents opportunities for traders to take advantage of overbought and oversold conditions at the upper and lower boundaries. Oscillators like RSI that measure overbought/oversold levels work very well in conjunction with broadening tops and bottoms. Traders look to take counter trend trades during the pattern formation, capitalising on the increasing volatility before the eventual breakout.
What are the limitations of Broadening Top & Bottom patterns?
Broadening patterns lack a definite shape or precise boundaries. The upper and lower points are subjective and traders do not agree on exactly when the pattern starts and ends. This makes analysis more challenging compared to patterns with clear trend lines like triangles and rectangles.
The extending volatility and whippy price action within broadening patterns leads to false breakdowns and failed breakouts. Traders get faked out entering or exiting positions as the price swings back and forth, testing support and resistance levels before the actual breakout. This unpredictability requires patience.
Broadening patterns sometimes take a very long time to fully form, especially in low volatility conditions. Their lack of concrete shape allows them to extend sideways longer than expected. Traders have to hold off taking positions in anticipation of the breakout much longer than with other patterns.
What is the difference between Broadening Top & Bottom vs double top & bottom pattern?
Broadening top and bottom chart patterns have a wider, megaphone shape showing increasing volatility and indecision between buyers and sellers over time while double tops and bottoms are more contained with two distinct peaks or troughs that show failed breakouts after advances or declines. While broadening patterns exhibit extending peaks and troughs over a longer duration before an eventual breakout, double patterns are shorter reversals after trend attempts fail at support or resistance twice.
The key differences are that broadening patterns signal disagreement and lack of conviction, whereas double patterns indicate waning momentum and inability to sustain a breakout through key levels. Broadening patterns have expanding volatility and uncertainty, while double patterns are more definitive trend reversals off distinct support and resistance levels after two failed attempts. Understanding these nuances is crucial in Technical Analysis. Mastery of Technical Analysis allows traders to distinguish between these patterns and make more informed trading decisions.
What are the other chart patterns available?
The other chart patterns available are the head and shoulders pattern, which involves a peak forming between two smaller peaks that create a shape resembling a head with two shoulders. The cup and handle pattern resembles a cup shape followed by a handle, indicating a potential reversal of a downtrend.
The double top and double bottom patterns involve two peaks or two troughs at around the same price level, signaling a potential trend reversal. Triangle patterns like ascending triangles, descending triangles, and symmetrical triangles indicate a period of consolidation before a breakout. Flag and pennant patterns are small consolidations that form as the price pulls back briefly during a strong trend. Understanding these chart patterns is essential for traders, as chart patterns can provide valuable insights into market behavior and potential future movements.


Share


No Comments Yet