Breakout Trading: Definition, Trading Strategies, Risk & Reward, Reliability, Limitation
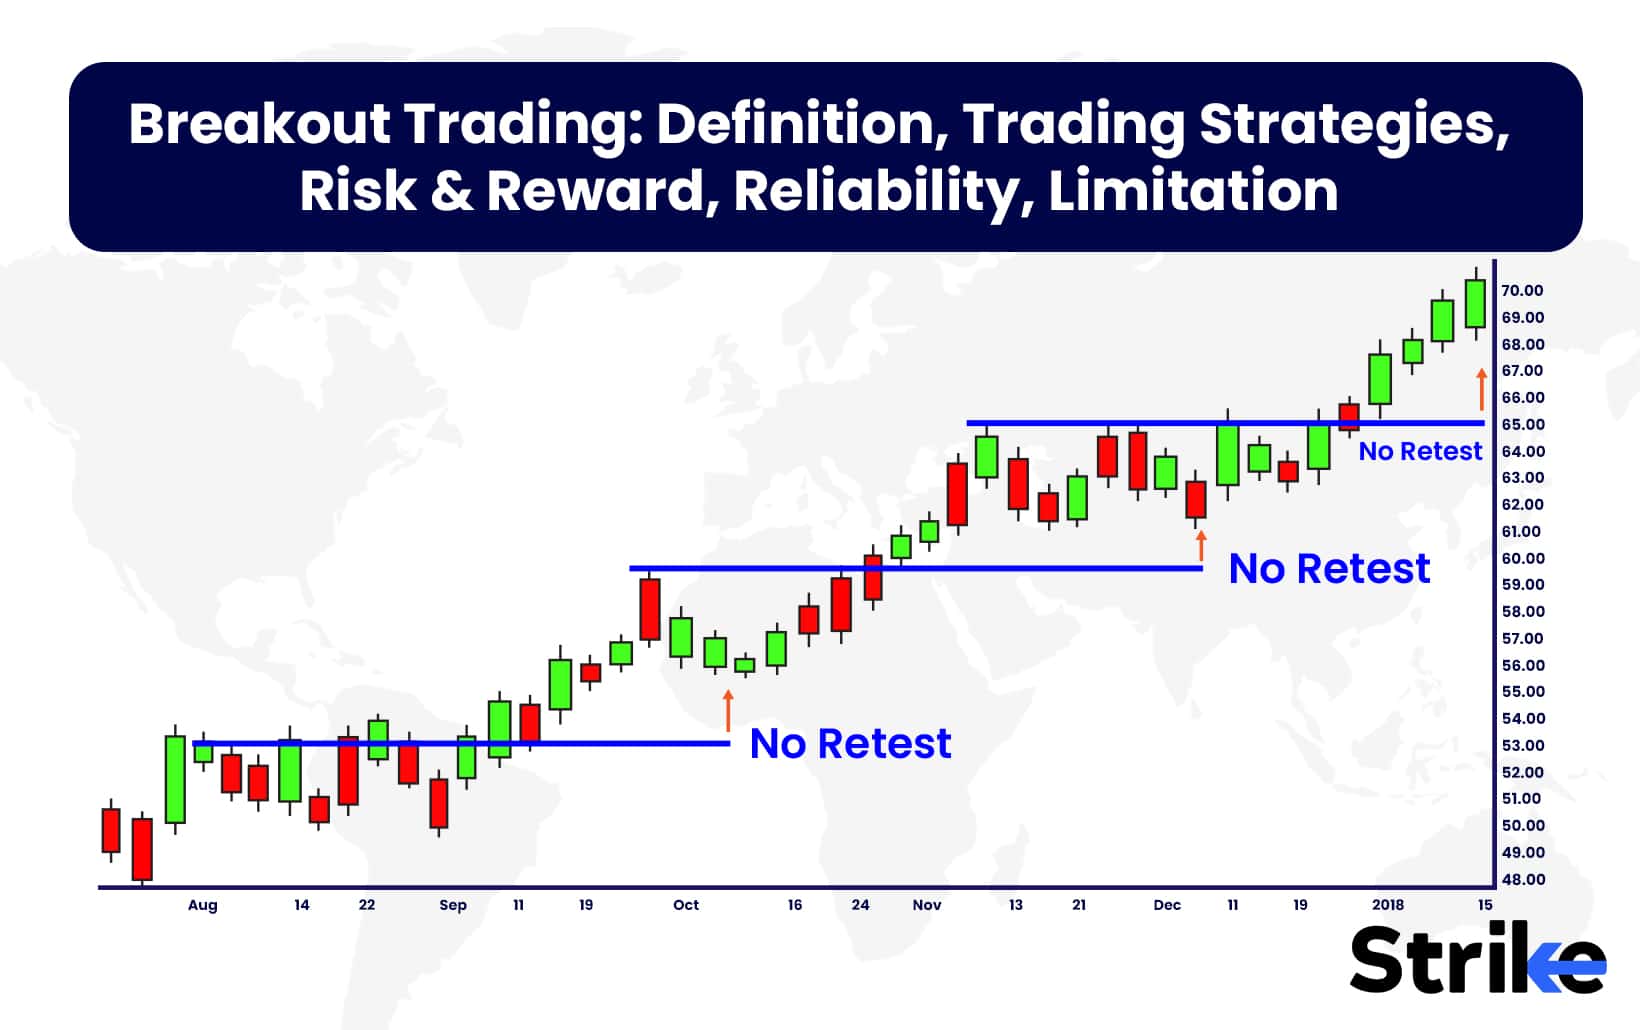


A breakout occurs when a stock’s price breaks past established support or resistance levels on strong volume, signaling an end to its recent range-bound trading and the potential start of a new trending move. Breakouts draw in additional buying or short covering that can fuel extended momentum moves. Traders seek out breakouts from proven pattern formations like flags, pennants and triangles that foreshadow continuation of the prevailing trend. Volume is crucial for confirming that institutional sentiment is behind the move rather than scattered retail participation prone to failure.
One learns to discern between fleeting fakeouts and breakouts heralding significant trends. Developing clear trading rules filtered by underlying market conditions and one’s personal style is paramount. While the risks of whipsaws and reversals require prudent risk management, well-scouted breakouts can result in sizeable rewards for those swift and selective enough to ride the accelerating momentum.
What is a breakout?
A breakout refers to when the price of a stock breaks out of a trading range it has been stuck in. Breakout often occurs after a period of consolidation, where a stock’s price fluctuates within a relatively narrow high and low range as buying and selling forces reach equilibrium. The breakout signals the end of this consolidation period, as either buyers or sellers gain control and the stock starts making new highs beyond resistance levels or new lows below support.
What are the different types of breakout trading strategies?
The main types of breakout trading strategies include price channel, volume, cup and handle, triangle, rectangle, gap, flat and pennant, head and shoulder, double top and bottom, horizontal, trendline, price action, momentum, and news based breakouts.
1. Price channel breakout
A price channel refers to a stock price that trades within a range between clearly defined support and resistance levels over a period of time. This sideways price action represents a period of consolidation as buyers and sellers reach equilibrium. A breakout occurs when the stock price breaks above resistance or breaks below support with high trading volume. A breakout signals the end of consolidation and the start of a new trend, either upside or downside. Traders look to enter new long positions on an upside breakout when the price closes above resistance, or enter new short positions on a downside breakout when the price closes below support.

In the above picture it signals a potential continuation of the move in that direction when the price breaks above resistance or below support with high volume. This is known as a breakout. Breakouts indicate a shift in supply and demand dynamics for the stock, as buyers or sellers gain control.
2. Volume breakout
Volume breakout refers to a large spike in trading volume for a particular stock that breaks above the average daily volume. This signals that there is increased interest in the stock and that a significant price movement might follow. Traders watch for volume breakouts as potential entry points into trades, as high volume sometimes pushes the price higher or lower. Volume breakouts indicate a shift in supply and demand dynamics for a stock, so they are seen as significant market events for traders to take note of. Take a look at the below image.

The image illustrates the concept of a volume breakout in trading. The top panel displays a candlestick chart showing the price movements of a security or asset over time. The bottom panel represents the trading volume or number of shares/contracts traded during each period.
The key aspect highlighted is the sudden spike or increase in trading volume, which is indicated by the tall green bars on the volume panel. This significant increase in volume is accompanied by a price breakout, where the price moves above a resistance level marked by the horizontal red line on the price chart.
The annotation on the image explains that this combination of a price breakout and a concurrent high trading volume is referred to as a “volume breakout.” It suggests that when the price surpasses a key resistance level while trading volume substantially increases, it could signal a potential continuation of the price move in that direction.
3. Cup & handle breakout
The cup and handle is a powerful bullish chart pattern used by technically oriented traders to identify buying opportunities in uptrends. It is identified by a U-shaped “cup” formation followed by a slight “handle” consolidation before a breakout. The cup shows a drop and consolidation in the stock price, while the handle represents a period of more modest gains setting up for the breakout. A cup and handle breakout is indicated when significant trading volume ultimately drives the stock price over the resistance level created during the handle. Traders will enter new long positions on a confirmed cup and handle breakout, as it is expected to start a new uptrend in the stock’s price.

The image highlights the formation of a bullish “Cup and Handle” pattern. This pattern is characterized by a large U-shaped curve on the left side (the “cup”), followed by a smaller downward drift on the right side (the “handle”). The image labels these two components, with the larger U-shape labeled as the “Cup” and the smaller downward drift labeled as the “Handle.”
4. Triangle breakout
Triangle patterns are created when a stock’s highs and lows converge to form a triangle shape over a period of consolidation. The boundaries of the triangle act as resistance and support levels that the stock price bounces between. A breakout is indicated once the price eventually breaks out of the triangular pattern due to high trading activity. Traders will enter positions in the direction of the triangle breakout, as it indicates the stock is starting a new uptrend or downtrend outside of the previous consolidation. Look at the image below.

The image suggests that once a triangle pattern breakout occurs, traders use the price difference within the triangle to estimate potential price targets. The breakout direction, either bullish (upward) or bearish (downward), will determine whether the target prices represent resistance or support levels.
5. Rectangle breakout
A rectangle pattern forms when a stock trades between clear support and resistance levels, creating a rectangular consolidation on the chart. The stock will bounce between these horizontal boundaries as buyers and sellers balance each other out. This back-and-forth price action continues until there is a high-volume move that breaks the stock out of the rectangle formation. Traders look to enter long positions on a resistance breakout or short positions on a support breakout. A rectangle breakout signals the end of consolidation and the start of a new trend, as buyers or sellers have overpowered the other side.

The image depicts a rectangle pattern. This pattern is formed by two parallel horizontal lines representing support and resistance levels, with the price oscillating between these levels. The upper horizontal line acts as the resistance level, above which the price struggles to move, while the lower horizontal line serves as the support level, below which the price finds buyers.
6. Gap breakout
A gap breakout occurs in the stock market when the price of a security opens above or below the previous day’s high or low price, with no trading occurring in between. This creates a ‘gap’ in the normal price pattern on the chart. Gap breakouts signify that there has been a fundamental shift in the supply and demand for the stock, caused by positive or negative news about the company. Traders look to trade gap breakouts in the direction of the price move, as they often indicate the start of a new trend. However, it is important to confirm the validity of the breakout with increased volume and follow-through buying or selling. Gap breakouts provide traders with opportunities to capitalise on the start of potential big moves in a stock’s price.

The image illustrates the concept of gap breakouts in technical analysis. A gap is formed when the price opens significantly higher or lower than the previous day’s close, leaving a visible gap in the price chart. Here’s an explanation in seven sentences:
The chart shows several gaps, including a breakaway gap early in the uptrend, which helps confirm the reversal to the upside. A runaway gap is also visible, indicating a strong continuation of the uptrend. Two of the marked gaps were associated with earnings announcements, which can often lead to significant price gaps. A gap breakout occurs when the price moves decisively beyond the resistance or support level established by a previous gap. Upward gap breakouts are considered bullish signals, suggesting a potential continuation of the uptrend. Downward gap breakouts are bearish signals, potentially indicating a resumption of the downtrend.
7. Flag & pennant breakout
A flag or pennant breakout occurs when the price of a security breaks out of a chart pattern resembling a flag or pennant shape. These patterns are created when trading consolidates into a tightening price range after a large advance or decline. The pole of the pattern is formed by the initial price move, while the flag or pennant shape is formed as prices oscillate in a narrow range. A breakout occurs when prices clear above or below the upper or lower boundaries of the flag/pennant formation on increased trading volume. Traders will enter positions in the direction of the breakout, as flags and pennants represent continuation patterns that signal the resumption of the previous trend in the stock’s price.

The image illustrates two technical analysis patterns – a pennant and a flagpole. A pennant is a small triangular formation that signals a period of consolidation after a strong price move. The pennant pattern in the image is highlighted and labeled. A flagpole is a straight price move preceding a pennant formation. The flagpole pattern preceding the labeled pennant is also highlighted in the image.
These patterns are used by traders to identify potential continuation signals after a brief pause or consolidation in the larger price trend.
8. Head & shoulder breakout
A head and shoulders pattern forms after an uptrend, creating three peaks with a head (middle peak) that is higher than the two shoulders (outer peaks). A neckline connects the bottom of the two troughs. A head and shoulders breakout occurs when the price closes below the neckline on heavy volume. This signals that selling momentum is intensifying and the prior uptrend is reversing. Traders will often short sell the stock on a confirmed downside breakout of the neckline, setting a profit target at the depth of the pattern from the breakout point. Overall, head and shoulders patterns represent a potential trend reversal, with downside breakouts viewed as bearish signals and upside breakouts as bullish signals.

The pattern consists of a left shoulder, formed by a smaller peak, followed by a trough, and then the head, which is the highest peak among the three. After the head, there is another smaller peak that forms the right shoulder, followed by another trough. A neckline is drawn to connect the troughs on either side of the head, and a break below this neckline, shown at 9.01 in the image, is considered a bearish signal. The head in this pattern is marked at the highest point of 13.48, indicating the potential reversal level. The head and shoulders pattern is widely used by traders to identify potential trend reversals from bullish to bearish.
9. Double top & bottom breakout

The double top and double bottom are formed when a stock hits the same support or resistance level twice without breaking through. For a double top, this signals the stock is facing strong resistance and an uptrend is ending. A strong volume break at the support level validates the pattern and marks the beginning of a fresh downward trend. For a double bottom, it signals the end of a downtrend, and traders watch for a break above resistance to confirm the reversal and enter long positions. Identifying double tops and bottoms allow traders to profit from the start of a trend reversal in a stock’s price action.
10. Horizontal breakout

A horizontal breakout occurs when the price of a stock breaks out of a trading range or consolidation period. The stock trades sideways between horizontal support and resistance levels for a period of time as it consolidates. A horizontal breakout occurs when the price begins to move outside of this range due to high trading volume. New highs being attained signify an uptrend shift if the breakout is above resistance. The price will plunge to new lows and a new downtrend will begin if the breakout is below support. Identifying horizontal breakouts early allows traders to position in the direction of the emerging trend as the consolidation period ends.
11. Trendline breakout

Trendlines are important tools in technical analysis that connect either swing highs or swing lows to show the prevailing direction of a stock’s price movement. An even stronger upswing is indicated when the price breaks above an upward-sloping trendline with significant volume. On the other hand, an accelerated downturn is signalled when the price breaks below a downward-sloping trendline with significant volume. Traders watch closely for valid trendline breaks that occur on increased volume as this provides trading signals in the direction of the emerging trend. Identifying trendline breakouts early allows traders to profit from the start of a new trend by entering positions in the breakout direction.
12. Price action breakout

Price action breakouts occur when the price of a stock moves outside a prior trading range or pattern. This signals that supply and demand dynamics are shifting and that a potential trend change is sometimes underway. Breakouts are considered more reliable when accompanied by increased volume, indicating conviction among market participants. Traders look to enter new long positions on upside breakouts and new short positions on downside breakouts. The challenge is identifying genuine breakouts versus false moves, but setting proper stop-losses help mitigate risk when trading breakouts.
13. Momentum breakout

Momentum breakouts happen when the price of a stock accelerates and breaks out of a trading range after establishing a strong trend. This signals that buying or selling pressure is intensifying and that the existing trend is likely to continue. Momentum breakouts are confirmed with high trading volume, showing increased conviction among market participants in the direction of the trend. Traders look to enter new long positions on upside momentum breakouts in an uptrend, or new short positions on downside breakouts in a downtrend. Managing risk is crucial when trading momentum breakouts, as overextended moves quickly retrace – using stop-losses and not over-leveraging helps mitigate this risk.
14. News based breakout
News-based breakouts occur when the price of a stock gaps up or down on high volume following a major news announcement about the underlying company. Positive earnings reports, clinical trial results, or new product launches catalyse upside breakouts, while regulatory actions, lawsuits, or CEO departures spark downside moves. The key is determining whether the news event is substantive enough to drive sustained buying or selling pressure after the initial spike. Traders look to trade in the direction of the breakout by buying upside gaps and shorting downside gaps. Managing risk is crucial with news-based breakouts, as the volatility often attracts shorter-term speculative trading and the moves sometimes reverse once the initial news reaction subsides.
Which breakout strategy is best?
There is no one universally best breakout strategy in trading. Skilled breakout traders employ a versatile toolkit, applying different techniques based on market conditions, support/resistance, trends, volume, risk management, and personal style. Through practice and review, they develop an intuitive feel for assessing setups and responding decisively. Consistency comes down to disciplined execution, risk management, and distinguishing between low and high-probability setups across changing environments. The most adaptable breakout traders fluidly apply the right tactic at the right time to give them the greatest edge.
How to find stocks for breakout trading?
To identify potential breakout stocks in the equity market, traders utilise technical analysis to spot shares that are consolidating within a range or pattern and show increasing volume or volatility, signalling a possible major price movement if the stock breaks out above resistance or below support.
The first key is doing your homework on the overall market and individual stocks. Study market news and analyst reports to see where the positive sentiment and fundamentals are. This helps you focus on stocks in sectors that see a lot of activity and money flows. You also want to research individual stocks to understand recent news, earnings, and any other catalysts that could drive a breakout. Look for stocks showing increasing volume, wide intraday price swings, and other signs of investor interest. The goal is to have a watchlist of stocks that look poised to make big moves on trigger events.
Breakout traders will scan the market for stocks showing certain technical indicators. For example, you sometimes screen for stocks trading near support or resistance levels, or showing bullish chart patterns like cups and handles. The goal is to identify stocks that look technically ready to break out on high volume. Key indicators to scan for include breaking out of longer-term trend lines and price channels, trading above key moving averages like the 50 or 200-day, showing bullish candlestick patterns and crossing average lines, forming ascending triangles and flag patterns on the charts and moving above recent highs and resistance levels
Volume is critical for validating breakouts. You want stocks with rising volume trends, especially as they reach breakout points. Analyse volume amounts over the last several weeks and months to identify stock accumulation. Also, look for surges in volume on recent up days and narrowing volume on down days. Breakouts tend to occur when volume spikes higher on a move through resistance levels. Use volume analysis across your watchlist to find stocks seeing accumulation that could drive a powerful breakout.
Look for stocks that have pulled back and ready to resume an uptrend. You want to identify previous runners that have good news and fundamentals but have since filled the gap in their trends. These stocks will often form solid support levels and technical patterns like bull flags and wedges during their consolidation periods. These stocks break out fast, quickly filling the previous gap when they resume the uptrend.
Screening tools automate finding stocks with certain technical and fundamental attributes. Input your desired criteria like price, volume levels, performance, earnings growth, industry groups and more. The screening program will filter the market to identify stocks matching your parameters. Online trading platforms and financial websites offer stock screening tools for free. You are also able to use stock scanners to look for new breakout setups each morning and add them to your watchlist. Just remember to always validate scanner results with your own analysis.
Traders will use breakout trading signals and alerts from services rather than identify their own setups. These highlight chart patterns, volume spikes, technical levels being reached and other indicators a stock is breaking out. Be sure to still validate that the setup makes sense fundamentally and technically if using breakout signals from an alert service or automated program. Use alerts more for discovering potential breakout opportunities rather than just blindly trading the signals.
Be patient and wait for stocks meeting your breakout criteria. Don’t chase stocks higher just because they are moving. Identify the key indicators you look for and wait for proper setups to emerge. And don’t compromise your criteria or make exceptions. Move on and find one that does if a stock doesn’t meet your parameters.
With breakout trading, it’s essential to use proper risk management. This includes only trading amounts you are able to afford to lose and using stop losses. Breakout traders will risk no more than 1-2% of their account per trade. You also sometimes want to scale out of positions as a breakout extends. For example, sell partial shares into strength once a stock hits certain higher levels after initially breaking out. Smart risk management will help you survive the inevitable failed breakouts.
Ultimately, you need to take responsibility for doing your own stock analysis and identifying potential breakout trades. Study chart patterns, volume trends, and technical indicators on stocks in sectors and industries seeing strong money flows. Use screeners and scans to generate ideas, but put in the work to validate setups. With research and practice, you’ll improve your ability to spot high-probability breakout opportunities. The key is persistence and honing your process for finding stocks ready to make big runs. Use analysis and indicators to spot emerging breakouts early and get in before the herd.
What is the ideal entry point for breakout trading?
A closing price above a resistance level that has been tested several times indicates the ideal entry position. This breakout should occur with a noticeable surge in volume, confirming increased buying interest and participation in the upside move. An increase in volume adds validity that the breakout is real and not a false breakout which quickly fails.
Once the stock closes above resistance, an entry order is placed just above the high of the breakout candle or bar. This confirms that previous resistance is now supported and provides confirmation that the breakout has follow-through. The initial stop loss is placed below the prior swing low or below the previously tested resistance level. This allows for a favourable risk-reward scenario since the stop is relatively close while profit targets are open-ended based on how long the new trend extends.
Timing the entry properly when the stock first breaks resistance with strong volume avoids the mistake of chasing the extended move too late. Being selective and waiting for ideal conditions aligns the trade with market momentum and the high probability start of a new uptrend. This disciplined approach helps improve breakout trading results and maximise profit potential.
What is the exit point for breakout trading?
The optimal time to close out a breakout trade is when the stock price retreats from its breach of a resistance or support level, indicating the breakout has failed and a reversal is underway.
Breakout trading relies on identifying key support and resistance levels that a stock has struggled to break through. The exit point is determined once the stock price successfully breaks through these levels. There are a few common approaches for determining exit points when breakout trading.
Traders will close out their position once the price hits a predetermined profit target, such as exiting a long trade after the stock price rises 10% above the breakout level. Others will trail a stop order below the breakout level to lock in gains if the stock price pulls back after breaking out. This helps protect any profits made if the breakout fails.
Breakout traders also consider exiting if the stock fails to see increased volume on the breakout. High volume confirms increased interest in the stock. Lack of commitment to the price rise is indicated by low volume, which increases the possibility of a false breakout. Identifying the right exit point is key to effectively trading breakouts in the stock market.
What are the support & resistance levels in breakout trading?
Support and resistance levels in breakout trading refer to price levels that act as barriers where a stock’s price tends to reverse or pause in its trend. Breakout traders look to trade when the price breaks out of these support or resistance levels and continues moving in a new direction.
These support and resistance levels form when a stock’s price bounces off the same price multiple times when selling or buying intensifies. This builds up pressure against a price barrier, establishing a level where the stock price struggles to break above or below.
Breakout traders look to trade when the price successfully breaks out of these established support or resistance levels. A break above resistance signals new buying interest and upward momentum, while a break below support indicates increased selling pressure.
The idea is to go long if price breaks above resistance with increased volume, signalling the start of a new uptrend. Conversely, traders go short if the price breaks below support on high volume, forecasting further downward momentum.
Once the stock price penetrates a support or resistance level, it tends to accelerate as orders are triggered and new traders jump in. The old support or resistance then becomes the new floor or ceiling going forward.
Breakout traders use technical analysis tools like horizontal support/resistance lines and trendlines to identify key breakout levels. Trading volume is monitored to confirm genuine breakouts versus false breakouts. Breakout trading offers defined entry and exit points using these support and resistance levels.
What should be the ideal risk-to-reward ratio in breakout trading?
A 1:2 risk/reward ratio is generally recommended as the minimum for breakout trading to be profitable over trades. It is important to have a favourable risk-to-reward ratio. This means the potential profit from a successful trade should be at least twice as large as the potential loss if the trade fails. Using proper stop losses and profit targets helps achieve this ideal ratio.
Experienced breakout traders utilise at least a 1:2 risk-to-reward ratio. This means the potential profit on a trade is at least twice as much as the risked capital. Your minimum profit target would be ₹1,40,000 for a 2X reward if you risk ₹70,000 on a position. However, successful breakout traders often look for even higher ratios before trading a setup. For example, a 1:3 risk/reward means the potential profit is 3 times the potential loss. Traders sometimes also look for 1:5 reward/risk in ideal conditions. Higher reward-to-risk ratios give you a greater margin for error on losses and account drawdowns. Even with a 30-40% win rate, positive expectancy models are able to be achieved with 2X or 3X reward relative to risk.
To determine your risk-to-reward ratio, clearly define both parameters. Risk – The maximum loss you will accept on the trade if it fails. This would be defined by where you place a stop-loss order, usually a few per cent below the entry price. Reward – The minimum upside profit target if the breakout succeeds, based on technical resistance levels, prior highs, or measured move projections. Dividing the profit target by the stop loss amount gives you the ratio. For example, a ₹21,000 profit target with a ₹7,000 stop loss would be a 1:3 risk-to-reward setup.
What is the best time frame to trade breakouts?
The daily chart is generally considered the best timeframe to use when it comes to trading breakouts in the stock market. Trading breakouts on the daily chart provide the ideal balance between giving trades enough time to develop while still allowing traders to capitalise on significant moves promptly.
Intraday time frames like the 5-minute or 15-minute charts are typically too short to provide reliable breakout trading. On short timeframes there are constant breakouts and fakeouts that fail quickly, generating excessive whipsaws and stop runs. The noise and volatility of short-term charts make it extremely difficult to capture any real momentum from valid breakouts. Intraday breakout trading requires very tight stops and precise timing, leading to more losses from stop runs.
On the other end of the spectrum, using weekly or monthly charts to trade breakouts causes traders to miss out on capturing large gains. On longer-term timeframes, breakouts take considerable time to develop and trigger entry signals. By the time the breakout confirmation occurs, the move has often already begun trending and the ideal entry point has passed. Trading breakouts on weekly or monthly charts leads to late entries and missed profit opportunities.
The daily chart provides the perfect balance of time versus sensitivity. Breakouts on the daily chart take time to confirm with follow-through, reducing false signals and whipsaws. A confirmed daily breakout shows strong momentum that is more likely to continue trending. At the same time, the daily chart is sensitive enough to trigger entries promptly, allowing traders to capitalise early on new trending moves. This combination of reliable signals with timely entries gives traders the best of both worlds.
The daily chart also aligns well with common risk management practices when determining ideal breakout entry and exit points. Stop losses and profit targets of several percentage points translate well into actionable levels on the daily chart. The daily time frame allows traders enough wiggle room to place stops wide enough to avoid premature stops while still capturing meaningful trends. For breakout trading, the daily chart constructively balances fast reaction times with the noise reduction of building conviction over multiple trading sessions.
How reliable is breakout trading?
Breakout trading is sometimes unreliable as breakouts often fail or result in false signals, so they carry inherent risks of whipsaws and trading against the larger trend. The premise behind breakout trading is sound. Momentum tends to persist as traders react to the price movement and news. Traders attempt to buy into strength as upside momentum builds in a stock or index. The hope is to benefit from extraordinary moves higher. It signals the potential for further upside follow-through when key technical levels are taken out due to increased buying pressure. Volume should expand on the breakout for confirmation. Strong breakouts with high volume become very tradable trends.
Breakouts happen frequently, but most do not result in sustained moves. It’s difficult to distinguish valid breakouts from false moves, so traders risk acting prematurely. Additionally, early breakout entries are prone to being stopped out if the move quickly reverses. Waiting for confirmation of the breakout increases reliability but sacrifices potential gains.
Trading breakouts require precise timing, but markets sometimes gap or reverse course rapidly. A gap up or down will miss the breakout entry entirely. Even with precise timing, whipsaws are common as momentum stalls or reverses. Getting shaken out frequently hurts profitability.
Once a breakout fades, it’s hard to tell if it will resume or reverse. Continuing to trade false breakouts leads to overtrading and unnecessary losses. It’s often better to wait for another setup than retry a failed breakout. Relying on unconfirmed broken trends is an unreliable tactic.
Trading purely technical breakouts ignores underlying market fundamentals or conditions. Without assessing whether conditions support the emerging trend, traders risk betting on false moves. Key news events or earnings help rapidly reverse momentum.
What are the limitations of breakout trading?
The limitations of breakout trading include false breakouts, failed breakouts, and whipsaw price action around support and resistance levels, as well as trading against the larger trend if the breakout quickly reverses.
The first limitation of breakout trading is that it relies heavily on strong momentum and trending moves in the market. Breakout trading strategies perform best when stocks are exhibiting strong directional moves and established trends. During range-bound or choppy market conditions when stocks lack a clear directional bias, breakout trading tends to underperform and generate more losing trades and whipsaws. Breakout traders often get faked out and take losses when breakouts fail during range-bound markets.
Another major drawback is that breakouts often fail or result in false signals. A stock’s price breakout over a certain resistance level does not ensure a continuation of the trend. Failed breakouts are common and rapidly turn profitable breakout trades into losers. False breakouts occur when a stock’s price breaks out but quickly reverses back within the previous trading range.
Breakout trading also has the risk of mistiming entry and exit points. Traders sometimes enter breakouts too early before the stock has established momentum or too late after the initial new trend has already run its course. Similarly, exiting breakout trades too early sometimes leaves profits on the table, while exiting too late erases gains when the trend reverses.
Another limitation is that breakout trading is prone to giving back gains quickly and abruptly if the momentum driving the trend suddenly shifts. Trend reversals and pullbacks are common even in strong uptrend and downtrend. Breakout gains disappear rapidly during market corrections and pullbacks if traders fail to take profits along the way. Being too greedy with breakout profits often ends badly.
Breakout trading strategies tend to underperform in choppy, sideways markets with no clear trends. Extended periods of range-bound price action offer certain tradable breakout opportunities and lead to whipsaws. Breakout traders are sometimes forced to sit idle during long non-trending market phases which impact overall profitability.
Since breakout trading is momentum-based, it leads traders to overtrade by focusing solely on the most volatile stocks making big moves. Overtrading and poor stock selection are common pitfalls. Trading lower-quality breakout stocks often leads to bigger losses when the momentum suddenly halts.
For breakout trading strategies to work, substantial trading volume is required to push prices through key resistance levels. However, high-volume breakouts are relatively rare. Much of the time, breakout attempts will fail due to weak volume and lack of buying pressure from institutional investors.
Breakout trading has a low win rate and high risk-reward ratio. Only about 40-50% of breakout trades are sometimes profitable even when properly executed. Thus, breakout trading requires a disciplined approach of cutting losses quickly while allowing winners to ride. Letting a couple of losing trades turn into big losses destroys overall profitability.
Since technical analysis chart patterns are well-known, breakout levels are often prone to manipulation. Savvy institutional traders sometimes purposely push prices through key breakout points, only to aggressively sell and reverse the breakout once retail traders have entered long positions. This phenomenon of stop running quickly turns winning breakout trades into losers.
Breakout trading works best for stocks with adequate liquidity and trading volume. Illiquid small-cap stocks and thinly traded securities often lack the institutional participation and trading activity required to generate meaningful momentum breakouts. As a result, breakout trading strategies tend to work better when applied to actively traded large-cap stocks rather than lower-volume penny stocks.
Is breakout trading profitable?
Breakout trading are profitable for disciplined traders using sound strategies, but reliability of signals is low so profits aren’t guaranteed; strict risk management is essential to limit losses from false breakouts. While experienced traders implementing robust analytical methods profit from breakouts, novice traders often succumb to the risks; trading costs like commissions and slippage become amplified with an aggressive breakout strategy; and technical analysis patterns are well-documented so breakout levels often draw manipulation attempts, hitting stop losses unexpectedly. For best results, traders should focus on stocks exhibiting clear trends, momentum and high volatility, while developing clear entry/exit rules based on price action, indicators or volume to reduce timing errors.
Which indicator is best for breakout trading?
Volume is the most important indicator for confirming valid breakouts, as high volume signals real institutional supply/demand driving prices. Indicators like on-balance volume (OBV) and volume-weighted average price (VWAP) specifically analyse volume flows to gauge if volume momentum aligns with breakout direction. The average true range (ATR) helps identify periods of increased volatility and breakout potential.
Moving averages confirm the underlying trend, while oscillators like RSI help assess overbought/oversold conditions. Bollinger Bands act as dynamic support/resistance for breakouts and their width indicates volatility levels. The ADX measures trend strength, while the directional movement system confirms breakout momentum direction. Fibonacci retracements identify probable breakout support/resistance levels during pullbacks in the overall trend.
What is an intraday breakout?
Intraday breakouts refer to breakouts occurring within the trading day, aiming to capture brief bursts of momentum as a stock’s price breaks key intraday levels like the opening price, support/resistance, prior highs/lows, and VWAP. Aggressive traders enter new positions instantly on a break, while conservative traders wait for a retest confirmation; constant monitoring of price action is required to optimally time entries and exits within an hour or two before momentum stalls.
Tight stop losses are essential for intraday breakouts as reversals occur readily; trailing stops to lock in gains as the move extends is prudent. High volatility, high volume stocks work best, and combining indicators like volume and RSI adds validity; patience and discipline in waiting for quality setups is key as most intraday breakouts quickly fail or retrace.
Is breakout bullish or bearish?
Breakouts themselves are not inherently bullish or bearish; rather, the directional bias depends on the overall price trend and where the breakout occurs relative to that trend, with breakouts above prior highs in an uptrend giving bullish signals, while downside breakouts below support in a downtrend give bearish signals. Upside breakouts draw further buying interest and suggest upside continuation in an uptrend, whereas downside breaks accelerate selling pressure and signal bearish momentum is resuming in a downtrend; in range-bound markets, the implications are less clear as breakouts often fail without a directional trend in place beforehand. Assessing the prevailing price trend, breakout magnitude, volume, and other indicators gives clues on validity and bias, with sharp high-volume breakouts confirmed by momentum and market internals having the highest probability of success.
How do you confirm a breakout?
Breakouts are confirmed when the price closes decisively outside support/resistance levels, especially on heavy trading volume indicating institutional participation; sharp powerful breakouts signal conviction better than gradual moves. Valid breakouts hold when tested by a pullback to the former breakout level turned support/resistance.
Breakouts aligned with improving market internals and emerging late in established trends have higher continuation odds. Closing beyond major moving averages and breaking out of chart patterns provides additional technical confirmation. Positive/negative momentum divergences before upside/downside breaks signal likely inflection points.
How to find a false breakout?
False breakouts are detected by analysing the magnitude and volume of the breakout move, checking if it aligns with the larger trend direction, looking for divergences between price and momentum indicators, watching for reversal candlestick patterns near the breakout level, observing the speed of rejection and failure to follow-through, and checking if the price stretches far beyond short-term moving averages.
Strong, high-volume breakouts that extend the trend with confirmation from momentum and sustained follow-through are valid signals, while weak, low-volume moves against the trend that quickly stall and reverse back toward moving averages are likely false breaks. Paying attention to the momentum, volume, and price action context around potential breakouts allows traders to distinguish between valid signals and false whipsaws.


Share


No Comments Yet