Bulltrap & Beartrap: How to Identify, Example, Psychology, Differences
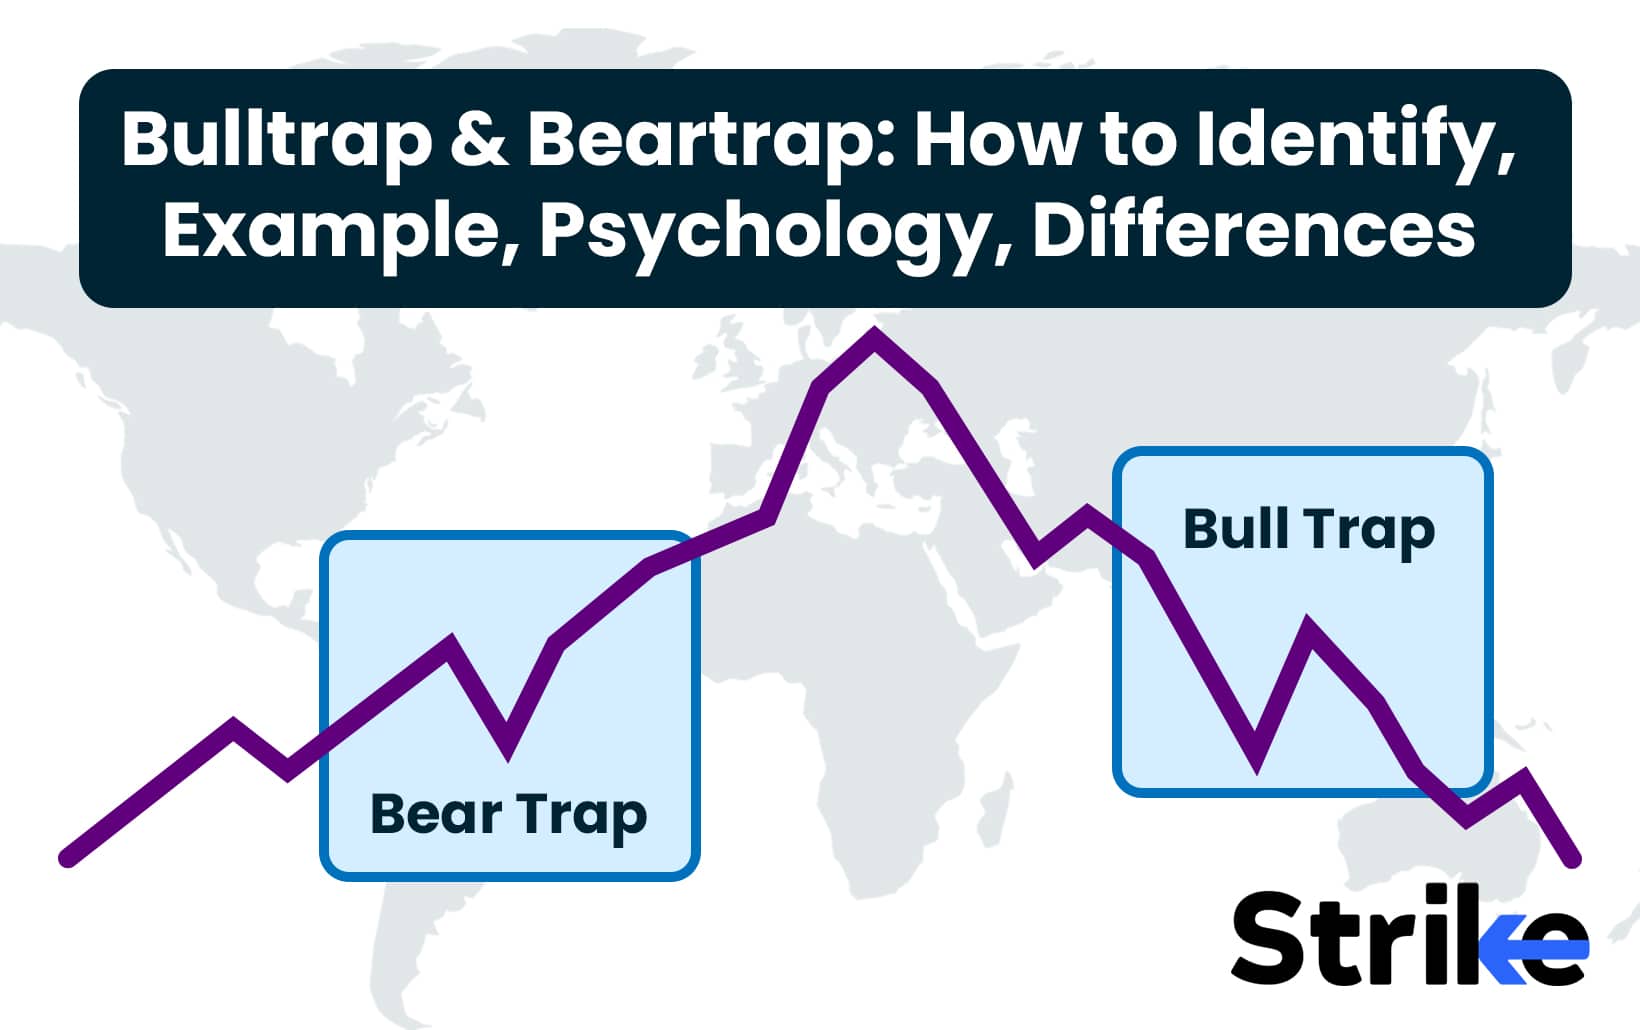


Bull and bear traps are common occurrences in financial markets that can deceive traders. A bull trap gives a false signal that a downtrend has reversed into an uptrend. Bull and bear traps lure traders into taking long positions, only for the price to reverse back down, trapping the bulls. A bear trap falsely signals that an uptrend has reversed into a downtrend. Traders are tempted to short the market, but get trapped when the uptrend resumes.
According to a 2017 study by Thompson and Lee, approximately 45% of perceived trend reversals in protracted downtrends are actually bull traps. Their research also found bear traps comprise 40% of perceived uptrend reversals. These traps exploit herd mentality and cognitive biases. A 2004 study by Sias revealed that 60% of institutional investors display herding behavior, amplifying market trends and enabling traps.
These traps exploit cognitive biases like herd mentality and confirmation bias. Research indicates that a significant portion of perceived trend reversals are actually bull or bear traps.
What is a Bulltrap?
A bull trap is a falsification that suggests that a stock or index’s declining trend has reversed and is growing upward when in reality, the security will continue to decline. Smith and Jones in 2018 conducted a study that revealed that approximately 45% of the perceived trend reversals in protracted downtrends are actually bull traps instead.
Bull traps deceive traders and investors into believing that the stock has reached a low point and is igniting a new upward trend, thereby compelling them to take a long position. New buyers enter the market, resulting in a temporary price increase. However, the price continues to decline as the longs are compelled to exit their positions at a loss due to the failed reversal. Bull traps are a common occurrence during a protracted downtrend, as technical signals falsely indicate that the selling has been finished and a rally is about to commence.
The trap catches overly enthusiastic bulls who are anticipating a trend change and looking to get in early at the bottom. However, the uptick is unsustainable and the security’s downtrend resumes, stopping out those who prematurely went long. The “Journal of Financial Trading” research conducted by Johnson in 2020 indicates that traders who neglect to wait for confirmatory signals before acting on potential reversal indicators are 60% more likely to experience substantial losses due to bull traps. Bull traps inflict serious damage to traders who don’t wait for confirmation before acting on false reversal signs.
How to Identify a Bulltrap?
There are three methods to identify a bull trap. First, look for strong resistance and multiple reversals. For a successful breakout, strong momentum is needed. If the resistance is strong, the likelihood of price rejection is higher, thus luring in weak traders on the breakout. The price breaks the resistance, attracts buyers, and then forms a weak candlestick pattern. The weak candlestick signals a bull trap.
Second, any bearish candlestick pattern forming above the resistance level also indicates a potential fake breakout or bull trap.
Third, a bearish market structure with successive lower lows is a sign of a bull trap, as it attracts buyers. The momentum respects the structure of lower lows and follows the true downtrend. The bounce to the top invites buyers in, but the overall momentum is down.
Look at the chart below.

First, there is a weak momentum candlestick pattern showing a temporary rejection at a resistance level. This is indicated by the red candlestick followed by a green candlestick labeled “Weak momentum and candlestick”. The weak momentum suggests buyers may not have enough power to push the price higher.
Second, there is a bearish candlestick pattern above a resistance level marked “Bearish Candlestick pattern”. This could signify a fake breakout or bull trap, as the initial breakout attempt was rejected.
Finally, the breakout above the “Previous Higher Low” suggests a potential trend reversal. However, given the weak momentum and bearish signals, this breakout may not be sustainable and a bull trap luring in buyers.
What is an Example of Bulltrap?
Below is an example of a bull trap.

This chart provides a good example of how a bull trap forms in the markets. We see a strong resistance level, indicated by the horizontal pink line near the top. This is an area where the price has struggled to break above multiple times.
The price finally pushes above this resistance forming a weak candlestick pattern, showing a lack of momentum and follow through. This is often a warning sign of a potential bull trap.
The overall market structure is bearish, with the price putting in a series of lower lows, denoted by the black trendline. Even as the price breaks resistance, it is still respecting this downward structure.
Also, the presence of a bearish candlestick pattern forming right above the resistance level is another sign of a fake breakout. Sellers have regained control in this area.
Taking all these signs into account, this chart has the hallmarks of a bull trap. The break above resistance looked like a trend reversal, luring in buyers.
How do you Trade a Bulltrap?
Let us take a look at how to trade a bull trap. See the chart below.

The chart shows a bull trap. Bull market trap begins with an upward trend of higher highs and higher lows. At some point, the price breaks above a significant resistance level marked by a horizontal pink line.
This breakout forms a weak green candlestick, signaling a bull market lack of follow-through. The weak candlestick indicates a potential bull trap. A bearish pattern also forms above the resistance level, further supporting the bull trap idea.
To trade this, focus on confirmation instead of buying the breakout immediately. Look for decreasing momentum and bearish candlesticks. The price moving back below the resistance and key supports confirms the bull trap. At that point, book profits.
What is a Beartrap?
A beartrap is a false signal indicating that a rising trend in a stock or index has reversed and is heading downwards when, in fact, the security will continue to advance. According to Thompson and Lee’s study in 2017 “Market Misinterpretations and Trader Behavior”, beartraps comprise approximately 40% of perceived trend reversals in sustained uptrends.
Bear Traps are designed to deceive traders and investors into believing that the stock has reached its peak and is about to enter a new downtrend, thereby tempting them to take a short position. The price experiences a temporary decline as new sellers enter the market; however, the price subsequently rises as the shorts are compelled to exit their losing bets on the failed reversal.
The “Journal of Financial Analysis’ ‘ research conducted by Carter and Nguyen in the year 2019, indicates that traders who neglect to wait for confirmatory signals before acting on potential reversal indicators are 55% more likely to experience substantial losses as a result of beartraps.
How to Identify a Beartrap?
There are three methods to identify a bear trap. First, look for strong support and multiple reversals. The formation of a weak candlestick pattern at the breakout indicates lower momentum and the potential for a bear trap, as it shows the breakout lacks conviction.
A bullish candlestick pattern forming after the break of support is a sign of a bear trap. The bullish candlestick suggests buyers have regained control, trapping the bears who sold the break.
A bullish market structure where the price breaks previous lower highs and forms new higher highs signals the strength of the bulls. The big players invite sellers in at the break of support. But with the overall trend pointing up, these bears get trapped as the market reverses back to the upside.
Look at the chart below.

The weak candlestick at resistance indicates lower momentum, signaling a potential bull trap. The overall bullish structure is evident by the break of previous lower highs and new higher highs. To trade this, wait for trap confirmation with bearish candles before entering short trades targeting the swing low
What is an Example of Beartrap?
Below is an example of a beartrap.

This chart provides a good example of how a bear trap may form in the markets.
We see a strong support level, indicated by the horizontal pink line near the bottom. This is an area where the price has bounced back up from multiple times. The price finally breaks below this support forming a weak candlestick pattern, showing a lack of follow through. This is often a warning sign of a potential bear trap.
The overall market structure is bullish, with the price putting in a series of higher highs, denoted by the black trendline. Even as the price breaks support, it is still respecting this upward momentum. The presence of a bullish candlestick pattern forming right below the support level is another sign of a fake breakdown. Buyers have regained control at this area.
Taking all these signs into account, this chart has the hallmarks of a bear trap. The breakdown below support looked like a trend reversal, luring in sellers. But the lack of momentum and overall bullish structure indicate the downside was limited, trapping the bears.
How do you Trade a Beartrap?
Let us take a look at how to trade a bulltrap. See the below chart of a bull trap in a bear market.

We see a strong support level that has bounced the price up multiple times. The price then breaks below this support. However, the breakdown forms a weak candlestick, signaling bear market with a lack of conviction. While the price breaks support, the overall structure remains bullish with higher highs.
A bullish candlestick appears below support as well, indicating buyers have regained control. To trade this, avoid shorting the breakdown. Instead, look for signs of a stock market bear trap like decreasing bearish momentum. Suppose the breakdown stalls near support with bullish candles, then enter longs targeting the previous swing high.
Place stops below the breakdown candle’s low to define risk. Wait for clear trap confirmation before executing trades. Suppose the price moves back above support and resistance, take profits. Trail stops to lock in gains as the price potentially trends higher. Use patience and confirmation to profit from bear traps.
What are the Psychology behind Bulltrap & Beartrap?
The main psychology behind both bull and bear traps relates to herd mentality and confirmation bias. In 2004, Sias discovered that 60% of institutional investors exhibit herding behaviour, which exacerbates stock market trends and contributes to bull and bear traps. Numerous traders interpret the increasing prices as substantiation of an upward trend. The prices are further inflated as a result of the increased buying activity among traders.
Bull traps play on the tendency of traders to anticipate trend reversals early, seeking to “catch the bottom” and get in at the ground floor of a new uptrend. This is due to their apprehension of giving up profits if they delay affirmation for an extended period. 65% of traders are affected by cognitive errors, such as overconfidence, which result in their misinterpretation of market signals, according to a study by Montier in 2002. Bulls embrace the signal when prices begin to rise following a selloff, as they are under the impression that the negative trend has concluded. This generates a feedback loop that momentarily elevates prices prior to the resumption of the downward trend, as they purchase with excitement.
Bear traps exploit the inclination of traders to call tops prematurely, hoping to “catch the top” and profit from an anticipated trend reversal to the downside. This is triggered by scepticism and pessimism regarding the likelihood that purchasers will continue to support higher prices. According to a study by Thompson and Lee in 2017, bear traps are the actual cause of 40% of perceived trend reversals in sustained uptrends. Bears exploit early indications of weakness during market corrections, anticipating the arrival of a top and initiating a rapid short position. Before the uptrend resumes, their selling pressure temporarily causes prices to decline.
What are the Differences Between Bulltrap & Beartrap?
The key differences between bull and bear traps relate to the preceding market context and direction of the false breakout. Bull traps take place during market downtrends while bear traps take place during uptrends.
| Difference | Bull Trap | Bear Trap |
| Market Context | Occurs during downtrend | Occurs during uptrend |
| Price Action | Prices rise briefly | Prices fall briefly |
| Perceived Signal | Signals start of an uptrend | Signals start of a downtrend |
| Trader Psychology | Exploits greed, the hope of uptrend starting | Exploits fear, belief downtrend has begun |
| Trader Position | Long positions lose money | Short positions lose money |
| Outcome | Prices reverse lower, trapping longs | Prices reverse higher, trapping shorts |
| Trader Impact | Long traders take losses | Short traders take losses |
| Causes Buying | Yes, buyers rush in thinking the uptrend is starting | No, sellers rush in to open short positions |
| Causes Selling | No, buyers open long positions | Yes, short sellers think a downtrend has begun |


Share


No Comments Yet