Put Call Ratio: Overview, Calculation, Interpretation, Uses, Reliability


PCR is an indicator that indicates market sentiment by relating the volume of the traded put option to that of the call option. PCR is calculated in two different ways—one with reference to the open interest and the other with reference to volume.
The interpretation is bearish if PCR exceeds 1 because more open positions are put options against calls. PCR below 1 denotes that the underlying sentiment is bullish. A Vol PCR above 1 reflects bearishness of the market, while below 1 reflects bullishness.
Traders quite often make use of the ratios as a contrarian indicator, wherein the extreme value may suggest a reversal of a market. For instance, high PCR may denote potential over bearishness of the market, which represents an opportunity to buy; a low PCR could then lead to a likely downturn.
Research by Billingsley and Chance (1988) in the Journal of Portfolio Management found that extreme PCR values often serve as contrarian indicators. Their study, analysing 10 years of options data, showed that PCR values above the 95th percentile or below the 5th percentile were associated with market reversals 68% of the time within the following month.
What is the Put Call Ratio?
The put call ratio (PCR) is an indicator used in options trading to gauge market sentiment. The put call ratio is calculated by dividing the number of traded put options by the number of traded call options. A high PCR suggests bearish sentiment as more traders are buying puts, while a low PCR indicates bullish sentiment, with more traders buying calls.
How is Put Call Ratio Calculated?
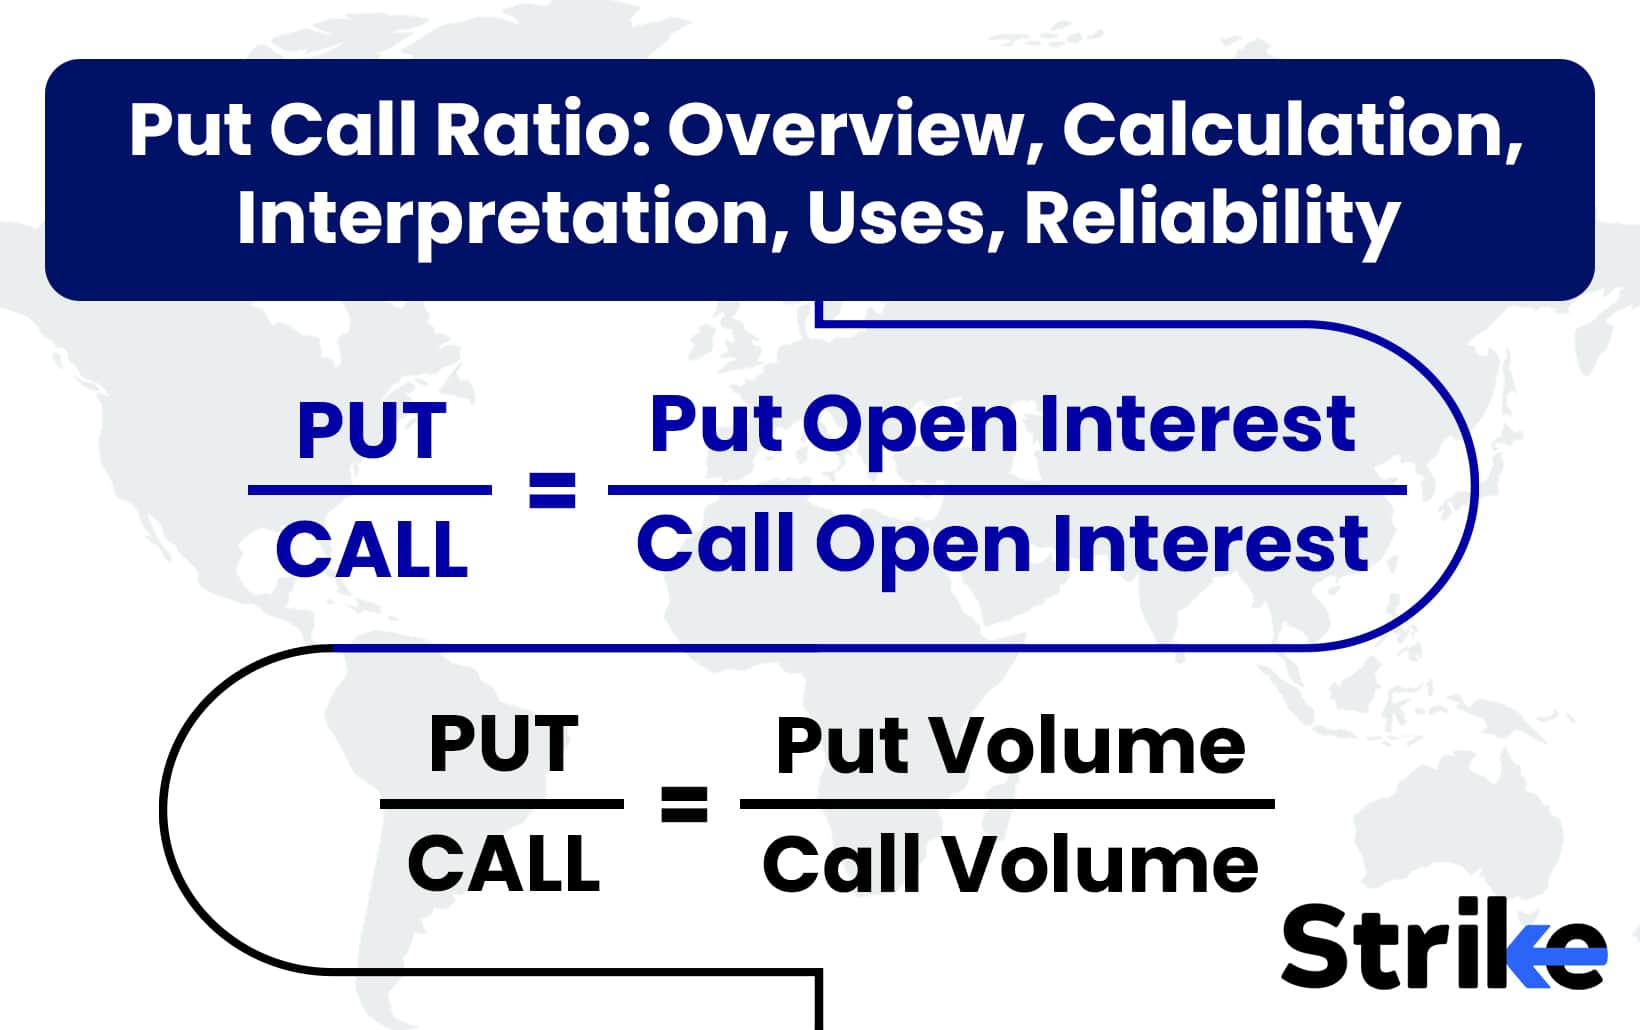
The put call ratio is calculated based on open interest and based on volume. Below is the explanation of both methods.
- Based on Open Interest
PCR based on open interest is calculated using the formula.
PCR= Open Interest of Put Options/Open Interest of Call Options
For example, suppose Reliance Industries Limited (RIL) has an open interest of 10,000 put options and 8,000 call options, the PCR would be 1.25. This indicates a bearish sentiment, as there are more put options than call options.
- Based on Volume
The PCR is calculated based on volume using the formula PCR = Traded Put Volume / Traded Call Volume
For example, consider the stock of Infosys. Suppose on a given day, the traded volume of put options is 1,200 contracts, and the traded volume of call options is 1,500 contracts. The PCR would be calculated as
PCR = 1,200 / 1,500 = 0.8
A PCR of 0.8 suggests a bullish sentiment, indicating more call options are being traded compared to put options. This implies that investors might be optimistic about Infosys’s future price movements.
How to Interpret Put Call Ratio?
PCR below 1, equal to one, and more than one are interpreted in different ways. Below are the common interpretations.
- PCR < 1
A put-call ratio (PCR) below 1 indicates a bullish market sentiment, meaning more call options are being purchased than put options. This suggests that investors expect the stock price to rise, as they are buying call options to benefit from potential gains.
For example, consider Tata Consultancy Services (TCS), an Indian company. Suppose the total traded volume of put options is 800 contracts, and the total traded volume of call options is 1,200 contracts.
The PCR would be calculated as follows
PCR = 800 / 1,200 = 0.67
This PCR of 0.67 indicates a bullish outlook for TCS, as more call options are being traded compared to put options, signalling investor optimism about future price movements.
- PCR = 1
A PCR of 1 indicates a neutral market sentiment, where the number of put options equals the number of call options being traded. This balance suggests that investors are neither predominantly bullish nor bearish about the market’s future direction. In such a scenario, there is an equal level of optimism and pessimism among traders, reflecting indecision or uncertainty about the market’s next move.
This neutral sentiment often occurs during periods of market consolidation, where prices are stable, and investors are waiting for new information or events to drive the market in a particular direction. While a PCR of 1 is neutral, it is not typically used as a benchmark for sentiment since more investors generally buy calls than puts, making a PCR of 0.7 a more common neutral point.
- PCR > 1
A PCR greater than 1 indicates a bearish market sentiment, meaning more put options are being purchased than call options. This suggests that investors expect the market or a particular stock to decline, as they are buying put options to hedge against potential losses or to profit from a downturn. A high PCR signifies that there is more demand for puts, reflecting a negative outlook among traders and investors.
For instance, suppose a stock’s PCR is 1.2. It implies that for every 100 call options, there are 120 put options being traded. This indicates a bearish sentiment, suggesting that investors are more concerned about potential declines in the stock’s price.
The study by Chakravarty, Gulen, and Mayhew (2004), published in the Journal of Financial and Quantitative Analysis, examined the predictive power of the put-call ratio (PCR) across different ranges. The researchers analysed 11 years of options data from 1988 to 1999, providing valuable insights into PCR interpretation. They found that when PCR was in the lowest quintile (below 0.8), stocks experienced an average positive return of 0.43% in the following week, outperforming the market by 0.21%.
Why is Put Call Ratio is Important in Trading?
PCR is important in trading because it offers valuable insights into market sentiment, indicating whether investors are leaning towards a bullish or bearish outlook. The PCR is used alongside other technical indicators, including Option Trading, to provide a more comprehensive view of market dynamics for market analysis.
Indicator for Market Sentiment
PCR) is a significant indicator for market sentiment, helping traders assess whether the market leans bullish or bearish. For example, suppose a company’s PCR is 1.5, it indicates more put options are being traded than call options, suggesting a bearish sentiment as investors anticipate a market decline. This ratio helps traders make informed decisions by providing insights into investor expectations and potential Stock Market movements, often serving as a contrarian indicator to predict reversals when sentiment reaches extremes.
Put Call Ratio in Stock Market Analysis
The Put-Call Ratio is as a stock market analysis that provides insights into market sentiment by comparing the volume of traded put options to call options. Traders use the PCR as a contrarian indicator, where extreme values might signal potential market reversals. For example, a very high PCR could suggest excessive bearishness, potentially indicating a buying opportunity. Monitoring the PCR helps traders adjust their strategies to align with prevailing market expectations and sentiment shifts.
Using PCR alongside other indicators, traders better understand investor behavior and make more informed trading decisions to optimize their strategies. This approach is supported by academic research, notably a study by Blau, Nguyen, and Whitby (2015) published in the Journal of Derivatives. Their comprehensive analysis, examining 16 years of options data from 1996 to 2012, found that combining PCR with other technical and fundamental indicators significantly improved forecast accuracy.
How to Use Put Call Ratio in Trading?
Put call ratio is used in short-term trading, long-term trading, historical PCR analysis, and PCR during market crashes. Below are the instance in more detail.
Using PCR for Short-Term Trading
Using the Put-Call Ratio for short-term trading provides traders with a quick gauge of market sentiment, helping them make informed decisions about potential market movements. In the short term, volume-based PCR is particularly effective in predicting market returns, as it reflects the immediate buying and selling pressures in the options market.
For instance, a sudden spike in PCR might indicate an oversold market condition, suggesting a potential buying opportunity for contrarian traders. Conversely, a sharp decline could signal an overbought market, prompting traders to consider selling.
Using PCR for Long-Term Investing
In the long term, PCR acts as a contrarian indicator, helping investors identify when market sentiment has reached unsustainable extremes. For instance, a consistently high PCR could indicate excessive bearishness, suggesting a potential buying opportunity as the market might be poised for a reversal.
On the opposite, a low PCR might signal excessive bullishness, warning investors of a possible downturn. Integrating PCR analysis with other fundamental and technical indicators help long-term investors better understand market dynamics, manage risk, and make informed decisions about portfolio adjustments to align with evolving market conditions and sentiment shifts.
Analysing Historical PCR Data
Analyzing historical PCR data is crucial for understanding long-term trends in market sentiment and potential turning points. Examining past PCR values helps investors identify patterns that may indicate future market behaviour, such as periods of extreme bullishness or bearishness. Historical PCR data reveals how market sentiment has shifted over time in response to economic events, policy changes, or market cycles. This analysis helps investors and traders anticipate potential reversals or continuations in market trends.
Comparing historical PCR data with other market indicators enhances the accuracy of predictions and informs strategic investment decisions. Despite the challenges in accessing comprehensive historical PCR data, leveraging available resources provide valuable insights into market dynamics.
PCR During Market Crashes
During market crashes, the PCR often experiences significant fluctuations, reflecting heightened investor anxiety and shifting sentiment. A surge in PCR, indicating more put options than call options, suggests that investors are increasingly bearish, anticipating further declines and seeking protection against losses. This behavior is observed during market downturns, where the demand for puts rises sharply as investors hedge against falling prices.
A very high PCR also serves as a contrarian indicator, suggesting that the market may be oversold and poised for a potential rebound once the panic subsides. Analyzing PCR during such periods helps traders and investors understand the extent of bearish sentiment and identify potential turning points in the market.
Analyzing PCR in short-term and long-term contexts, as well as during Stock Market Crashes and through historical data, helps traders and investors make more informed decisions and anticipate potential market shifts.
How to Monitor PCR?
Strike helps you monitor PCR easer It is accessed by clicking on the ‘Analyse’ icon on the left sidebar. Hover over ‘Options’ and find the Options PCR tool in the menu.

Strike offers two kinds of PCR indicators that are useful in understanding the sentiment of market participants in the Options Segment.
The first type of PCR available on Strike is OI PCR (Open Interest PCR).
The second type of PCR available on Strike is Vol PCR (Volume PCR).
To understand OI PCR, we need to know what open interest means.
Open interest is the total number of outstanding contracts (unsettled contracts) that are still active. It indicates the number of open positions of the underlying asset. Thus, the OI PCR is calculated as:
OI PCR = Open Interest of Put Options / Open Interest of Call Options
Open interest is helpful in determining the bullish or bearish sentiment of an underlying asset. An OI PCR greater than 1 indicates that open positions in put options are more than open positions in call options, thereby indicating a bearish sentiment. An OI PCR less than 1 suggests a bullish sentiment, as open positions in call options are more than open positions in put options.

See the chart uploaded above, and note the purple boxes that indicate where the market respects the OI PCR values. Observe the blue line that indicates the 1.00 level. This is how OI PCR values are used as a valuable confluence in a trade setup, gauging market trends, sentiment, and as a confirmation of trends. The troughs and crests are used as potential key levels where OI activity has the potential to change, acting as support and resistance levels.
To understand Vol PCR (Volume PCR), we need to know what open interest means. Vol PCR is calculated as:
Vol PCR = Volume of Put Options / Volume of Call Options
A Vol PCR greater than 1 indicates a bearish sentiment. A Vol PCR less than 1 suggests a bullish sentiment. Extreme points indicate potential opportunities for trend reversals. Below, the attached image is an example of Volume PCR of Nifty 50.

Observe the purple boxes and watch the reaction of the Nifty 50 and its response at these points.
What are Common Mistakes to Avoid while using PCR?
Here are eight common mistakes to avoid when using the Put-Call Ratio in trading..
| Mistake | Description |
| Overreliance on PCR Alone | Depending solely on PCR without considering other indicators sometimes leads to misinterpretation. PCR should be used alongside other technical and fundamental analyses to form a comprehensive view of market sentiment. |
| Ignoring Market Context | Failing to consider the broader market context, such as economic events or geopolitical factors, sometimes skew PCR interpretation. It’s crucial to integrate PCR analysis with an understanding of current market conditions. |
| Misinterpreting Extreme Values | Misreading extreme PCR values sometinmes lead to incorrect assumptions about market reversals. Traders should recognize that high PCR values might not always indicate a buying opportunity, especially during prolonged bearish trends. |
| Neglecting Historical Benchmarks | Not comparing current PCR values with historical data often result in misjudging market sentiment. Historical analysis helps identify whether current PCR levels are genuinely extreme or within normal ranges. |
| Ignoring Volatility and News Events | Sudden market volatility or news events sometimes cause temporary spikes in PCR, which may not reflect sustainable sentiment changes. Traders should be cautious of reacting to short-term PCR fluctuations without additional confirmation. |
| Lack of Defined Thresholds | Without clear overbought or oversold thresholds, interpreting PCR is subjective. Traders should establish their own benchmarks through backtesting and historical analysis. |
| Failure to Adjust for Option Expirations | Variations in option expirations skew PCR readings. It’s important to account for these variations to avoid misinterpretation. |
| Not Considering Option Volume and Open Interest Separately | PCR is calculated using both volume and open interest, each providing different insights. Traders should analyze both metrics to get a fuller picture of market sentiment. |
Is Put Call Ratio a Reliable Indicator?
Yes, the put-call ratio is considered a reliable indicator, particularly as a contrarian-sentiment measure. It helps traders gauge market sentiment by comparing the volume of put and call options. However, it is most effective when used in conjunction with other indicators to provide a more comprehensive market analysis.
What is a good PCR?
A good PCR ratio typically ranges from 0.7 to 1.0, indicating a balanced sentiment in the options market. A good PCR sometimes could vary by industry. The technology sector often exhibits higher volatility, which might lead to more pronounced swings in PCR as investors react to rapid changes in market conditions or technological advancements.
Financial sector PCR might reflect broader economic conditions, such as interest rate changes or regulatory shifts, influencing investor sentiment. Sentimen is often driven by regulatory news, drug approvals, or healthcare policy changes, affecting PCR values in the healthcare sector.
What is an Extreme PCR?
An extreme PCR (put-call ratio) means the market sentiment is at one of its extremes—either overly bearish or overly bullish. A high put-call ratio indicates that more puts are being bought than calls, suggesting a bearish outlook. To contrarian investors, this can signal a potential buying opportunity, as the market may be unduly bearish and due for a rebound.
Conversely, a low put-call ratio suggests a bullish sentiment, where more calls are being purchased. Contrarians might see this as a sign that the market is too optimistic and could be primed for a pullback.
How to Combine PCR with Other Technical Analysis Indicators?
The Put-Call Ratio is often combined with other indicators of technical analysis, such as India VIX. This would add to the trading strategies in having a better view of sentiments and price movements. PCR shows the volume of Put options against Call options. Through it, one will be able to know whether the sentiment of the market is bearish or bullish. An extreme reading in PCR normally indicates the possibility of a reversal in markets. Hence, this might turn out very important for contrarian investors.
On the other hand, India VIX computes the volatility in the market from implicit volatility of the NIFTY options. The index contains information about what the market expects for future volatility. It would hence mean that with a high India VIX, there is so much uncertainty in the market and, generally, swings in prices. A low VIX denotes stability.
Therefore, integration of PCR with India VIX will help traders get fine market insights. For example, a high PCR reading coupled with a rising India VIX could suggest strong bearish sentiments against the backdrop of increasing volatility, thus constituting a signal for a possible downturn of the market. In contrast, low PCR values with receding VIX may indicate bullish sentiment associated with reduced volatility, which again is perceived as pointing toward a stable uptrend.
Further, other indicators—moving averages or candlestick patterns also allow for additional refinement of the trading decision. They provide confirmation signals to the trader, thus confirming the insights obtained in PCR and India VIX and providing more informed and strategic trading decisions.
Why PCR is Considered as a Contrarian Indicator?
PCR ratio is called a contrarian indicator because PCR captures the major market sentiment, and its extreme values often tend to portend reversals. A high PCR means that more put options are purchased than call options, thereby expressing bearish sentiments. Contrarian investors see this as a buying opportunity because the market would then turn overly pessimistic and hence there may be a resulting bounce.
Extreme values in PCR have been able to precede market reversals in that they happen with the emotional extremes of traders. Contrarian investors use their best judgment to profit from market inefficiencies, simply by going against the market sentiment of the public.


Share


No Comments Yet