Bull Put Spread: Overview, Example, Uses, Trading Guide, P&L, Risks


The Bull Put Spread is an option strategy formed after the introduction of options trading on NSE in 2001.The Bull Put Spread gained traction among Indian traders, particularly during the 2010-2020 decade when the derivatives segment witnessed a 300% growth in trading volumes.
Traders primarily use Bull Put Spreads during trending markets with low volatility. This strategy proves particularly effective for blue-chip stocks and major indices like Nifty50, where price movements tend to be more predictable.
The trading guide involves four key steps. First, identify stocks showing bullish momentum. Second, select strike prices based on support levels. Third, ensure adequate liquidity in both options. Fourth, monitor the position until expiration or target achievement.
Profit and loss calculations remain straightforward. The maximum profit occurs when the stock price stays above the higher strike price at expiration. The break-even point equals the higher strike price minus the net credit received.
Traders must consider several risks. Market reversals pose the primary threat, especially during quarterly results or major economic events. Additionally, liquidity risk exists in less-traded options. Time decay affects both options differently, potentially impacting the spread’s value. Proper position sizing and strict stop-loss implementation help manage these risks effectively.
What is a Bull Put Spread?
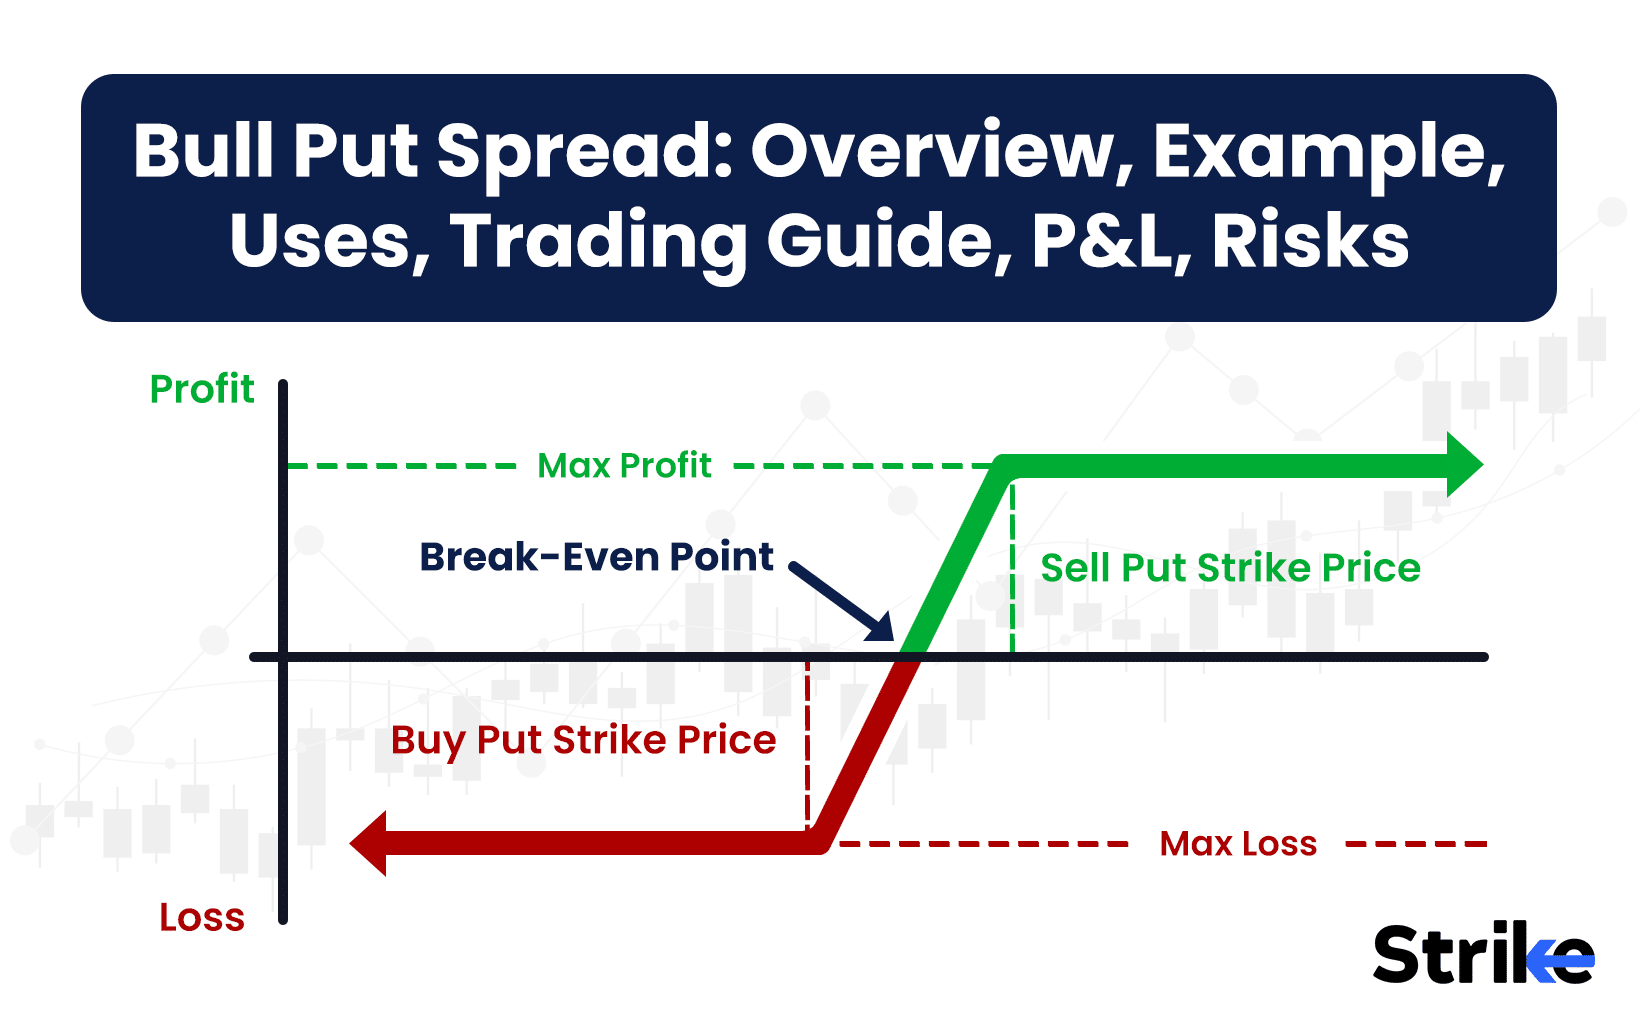
A Bull Put Spread is a strategy that involves selling a put option at a higher strike price while simultaneously buying a put option at a lower strike price, with both options having identical expiration dates on the same underlying asset. Look at the image below.

The Bull Put Spread strategy generates an immediate credit at trade initiation, making it a credit spread.
The strategy becomes profitable when the underlying asset price remains above the higher strike price at expiration.
The credit nature stems from the higher premium collected from the sold put compared to the premium paid for the purchased put.
How Does a Bull Put Spread Work?
A Bull Put Spread works through a strategic combination of two put options with distinct strike prices but identical expiration dates.
The Bull Put Spread strategy proves particularly effective for index options like Nifty and Bank Nifty, where liquidity remains consistently high.
The mechanics involve selling a put option at a higher strike price while simultaneously buying a put option at a lower strike price. Look at the image below.

The image shows the profit/loss (P&L) profile of a 95-100 bull put spread both at expiration (solid blue line) and prior to expiration (dotted red line). The key elements of the graph are below.
- X-axis: Represents the price of the underlying asset at expiration.
- Y-axis: Represents the profit or loss from the strategy.
- Strike Prices:
- The lower strike price is 95.
- The higher strike price is 100.
Price Below 95
- Both the 95 put (bought) and the 100 put (sold) are in the money.
- The maximum loss occurs in this region, as the difference between the strike prices (100 – 95 = 5) minus the initial net credit received is realized.
- This is shown as a flat line below 95 on the blue curve.
Price Between 95 and 100
- In this range, the 100 put (sold) is partially in the money, while the 95 put (bought) remains out of the money.
- The loss decreases as the underlying price rises, with the position breaking even at a specific price (determined by the initial credit received).
- Price Above 100
- Both put options expire worthless, resulting in the maximum profit (which is the initial net credit received).
- This is represented by the flat line above 100 on the blue curve.
The maximum loss is capped and occurs if the underlying price falls below the lower strike price (95). In this case, the spread’s loss equals the difference between the strike prices (95) minus the initial credit received.
The solid blue line shows the final P&L at expiration, while the red dashed line shows how the position’s value changes before expiration, accounting for time decay and changes in implied volatility.
Why Use a Bull Put Spread Strategy?
Traders use a bull put spread for income generation, risk management, and capital efficiency mainly.
- Income Generation
The strategy enables traders to earn consistent premiums in neutral-to-bullish markets.
- Risk Management
Unlike naked put selling, where losses mount as stock prices fall, bull put spreads provide built-in protection. The bought put option creates a floor for potential losses. This proves crucial during unexpected market events, like quarterly results or global market volatility.
- Capital Efficiency
The strategy requires significantly less capital compared to direct stock purchases. For example, buying 100 shares at ₹1,600 requires ₹160,000, whereas a bull put spread with similar exposure needs only the difference between strike prices as margin (typically ₹5,000-₹10,000).
It also offers defined risk-reward parameters from the outset of the trade and lower margin requirements compared to trading naked options. It provides flexibility in selecting strike prices based on the trader’s risk tolerance, protection against time decay through its spread structure, and serves as a suitable strategy for portfolio hedging.
This strategy particularly suits retail traders managing moderate portfolio sizes while seeking consistent returns with controlled risk exposure.
When to Use a Bull Put Spread?
The bull put spread strategy is most useful during steady uptrends in quality stocks like TCS or Infosys, particularly when markets exhibit low to moderate volatility. Periods of range-bound movement with upward bias present optimal opportunities, especially during consolidation phases after significant corrections. The strategy also performs well before positive catalysts like dividend announcements or quarterly results.
The strategy delivers optimal results when implied volatility (IV) stands moderately high. For instance, premium levels become attractive for selling puts, when Nifty’s India VIX reads between 15-20. Higher IV translates to better credit received, enhancing potential returns. This scenario often occurs during result seasons or ahead of significant economic events.
Risk tolerance plays a crucial role in implementation. Conservative traders benefit from selecting strikes further out-of-the-money and focusing on index options for better liquidity. They often prefer monthly expiries for time decay benefits.
Moderate risk-takers choose closer strike prices for higher premium collection, trading in large-cap stocks with stable price movements, and implementing weekly expiries for faster time decay.
Timing considerations remain essential for success. Traders achieve better results by deploying during strong technical support levels, executing when moving averages show bullish crossovers, and entering positions 30-45 days before expiration for optimal time decay.
The strategy works exceptionally well in sectors showing steady growth patterns, such as IT, Banking, and FMCG stocks, particularly during high-liquidity hours between 9:30 AM and 3:00 PM IST.
How Option Greeks Affects Bull Put Spread?
Option Greeks like Delta, theta, and vega primarily influence a bull put spread’s performance. Delta increases the spread’s value as the stock price rises above the short put strike, while theta decay benefits the position due to its net short options exposure. Vega reduces the spread’s value during periods of rising volatility.
Consider a bull put spread with strikes at ₹1000 and ₹950 on a stock . Delta provides positive returns as the stock moves above ₹1000, with maximum gains capped at the net credit received. Theta works in the trader’s favor since both puts lose value over time, but the short put decays faster than the long put.
This accelerated decay generates consistent profits, especially in the final weeks before expiration. Rising implied volatility hurts the position because the long put’s vega sensitivity proves insufficient to offset the larger vega exposure from the short put. Gamma affects the position minimally unless the stock price approaches either strike price.
The spread exhibits peak gamma risk near the short strike, where delta changes occur most rapidly. Rho plays a minor role, showing slightly negative correlation with interest rates due to the put options’ characteristics. Overall, theta remains the dominant Greek, making this spread popular among premium sellers in Indian markets seeking consistent time decay profits.
How to Trade using Bull Put Spread?
Trading using a bull put spread is a four step process – starting from picking the right stock to exiting the trade at the right moment. Below is an overview.
1. Select an Underlying Stock
Choose a stock that is showing signs of taking support from a significant price level. The strategy works best when you remain mildly bullish, ensuring the stock price stays above the strike price of the sold put. Since this is a net credit spread, volatility is less of a concern, but a stable or slightly volatile environment can help theta (time decay) work in your favor.
2. Choose Strike Prices and Expiration Date
Strike price selection is crucial in a bull put spread. Out-of-the-money (OTM) options are generally more favorable as they are heavily influenced by time decay due to their lack of intrinsic value. OTM options are less risky because their premium rises sharply only in highly volatile or one-sided momentum scenarios.
An OTM spread offers a favorable risk-to-reward ratio. However, traders with a stronger conviction about the underlying asset’s technical movement may opt for a riskier credit spread by selling at-the-money (ATM) or near in-the-money (ITM) put options — that is, selecting a strike price closer to or even below the current market price. While this increases the profit potential, it also carries a higher level of risk.
3. Enter the Trade and Manage the Position
Enter the trade when your technical analysis confirms a bullish to range-bound momentum. Once in the trade, monitor the stock’s support levels and implied volatility (IV). If the stock shows signs of weakening support, consider an exit strategy or adjust the position to limit potential losses.
Suppose the price remains above the strike price of the sold put, your position will benefit from time decay, improving its profitability over time.
4. Close or Let the Trade Expire
Suppose the stock price stays and closes above the short put strike at expiration, both the sold and bought puts will expire worthless, allowing you to keep the full premium as your maximum profit.
However, in Options Trading, suppose the price drops below the breakeven point — consider exiting the trade early to limit potential losses. Alternatively, if the trade becomes profitable before expiration due to a price rise, you may choose to close the position early, provided it aligns with your risk-to-reward objectives.
Look at the image below.

An out-of-the-money (OTM) bull put spread is created, which is comparatively less risky. With 12 days remaining until expiry, theta decay will be at its maximum potential as the expiry date approaches. However, before this point, the premium behavior may reflect temporary losses. The strategy’s original profitability will only be realized if the price remains above and closes above ₹232.50 at expiry.
- If Wipro closes below ₹230.50 at expiry: The position will result in a loss.
- If Wipro closes between ₹230.50 and ₹232.50 at expiry: The position will yield a profit, albeit not the maximum profit.
- If Wipro closes above ₹232.50 at expiry: The position will achieve its maximum profit.
Now, look at the below image.

An OTM put option is sold at ₹4.5 (232.50 PE), while a farther OTM put option is bought at ₹2.1 (220 PE) as a hedge.
Since the option with the higher premium (232.50 PE) is sold, this creates a credit spread. The net premium received is:
₹4.5 – ₹2.1 = ₹2.4 per point/lot
With Wipro’s lot size being 3,000 shares, the profit or loss per point is calculated as:
3,000 × ₹1 = ₹3,000
The maximum profit occurs when both options expire worthless. This is equal to the net premium received per lot:
₹3,000 × ₹2.4 = ₹7,200 (1 lot)
This strategy benefits from time decay and will be most profitable if Wipro remains above ₹232.50 until expiry.
What are the Maximum Profit & Loss on a Bull Put Spread?
The maximum profit in a bull put spread is the net credit received when the trade is initiated. The maximum loss is the difference between the strike prices of the two put options minus the net credit received
Consider a bull put spread on with strikes at ₹1,650 and ₹1,600. Selling the ₹1,650 put brings in ₹30, while buying the ₹1,600 put costs ₹15.
The net credit received is ₹15 (₹1,500 per lot). The maximum profit of ₹1,500 occurs above ₹1,650, where both puts expire worthless.
The strike width of ₹50 (₹5,000 per lot) minus the ₹15 credit determines the maximum loss of ₹35 (₹3,500 per lot). This loss materializes below ₹1,600, where both puts reach full intrinsic value.
Break-even sits at ₹1,635 (short strike minus net credit). The position profits above ₹1,635 and loses money below it. The limited risk-reward profile makes this strategy popular among Indian options traders.
The defined risk lets traders size positions appropriately within SPAN margin requirements while the high probability of success from selling premium provides consistent returns in the Indian derivatives market.
What are the Risks of Bull Put Spread?
There are three main risks of a bull put spread – price dropping below the lower strike, limited profit potential, and the potential for assignment if the short put expires in the money.
- Stock Price Dropping Below Lower Strike: The position reaches maximum loss territory as prices decline below the lower strike.
Take a 1650/1600 bull put spread opened for ₹15 credit – the position loses ₹3,500 per lot (₹5,000 strike width minus ₹1,500 credit) with below ₹1,600. The protective long put prevents further losses, yet the initial investment faces complete depletion.
The downward momentum often accelerates losses before defensive adjustments become possible.
- Limited Profit Potential Compared to Naked Put Selling: The strategy caps profits at the initial credit received. The protective long put, while limiting risk, eliminates additional profit potential from continued price increases.
A naked short 1650 put would capture full profits from any volatility decline or price strength. The spread’s ₹1,500 maximum profit represents only a fraction of naked put selling potential gains. The reduced profit potential trades off against the defined-risk protection.
- Potential for Assignment if Short Put Expires In-The-Money: Assignment risk emerges as prices breach the short strike level. The trader becomes obligated to purchase one lot (100 shares) at the short strike price.
For example, trading at ₹1,630 near expiration triggers assignment on the short ₹1,650 put. The resulting stock position demands additional capital of ₹1,65,000 and creates unwanted market exposure. The spread’s risk parameters break down upon assignment, requiring immediate position adjustments to maintain intended risk levels.
Bull put spreads offer defined-risk exposure to downward price moves, but careful management is required to mitigate the key risks of breaching the lower strike, limited profit potential compared to naked puts, and potential assignment on the short leg.
Is Bull Put Spread Strategy Profitable?
Yes, a bull put spread strategy is profitable, particularly in a market that is expected to be stable or slightly bullish.
Bull put spreads generate consistent profits through a high probability of success and defined risk-reward parameters. The strategy profits from time decay, decreased volatility, and moderately bullish price movement.
Consider a 1650/1600 bull put spread collecting ₹15 credit – the trade earns ₹1,500 per lot with a 70% probability of success. Monthly implementation of this strategy across diversified Nifty50 stocks creates a steady income stream.
The limited risk nature protects capital while allowing portfolio scaling and compound growth within SEBI’s derivatives trading guidelines.
Is Bull Put Spread Bullish or Bearish?
Bull put spreads express a moderately bullish outlook on the underlying stock. The strategy profits from sideways to upward price movement, making it inherently bullish in nature. The name “bull put spread” directly reflects its directional bias.
The position generates maximum profit as the stock price stays above the higher strike price. A trader implementing this strategy expects the stock to maintain or increase its current price level by expiration.
The defined-risk structure provides bullish exposure while limiting potential losses from unexpected price declines.
What are Alternatives to Bull Put Spread Strategy?
Alternatives to bull put spread includes Credit call spreads, Iron condors, Naked put selling, Debit spreads.
A credit call spread involves selling a call option and buying a further out-of-the-money call option to limit risk.

This generates an upfront credit like a put spread, profiting if the underlying stays below the short strike at expiration.
An iron condor combines a bull put spread with a bear call spread for a market neutral position.

It profits if the stock remains between the inner short strikes at expiration.
Naked put selling involves shorting puts without a long put leg to define risk.

It profits if the stock remains above the short put strike at expiration.
Debit spreads like bull call spreads and bear put spreads have an inverted risk/reward from credit spreads.

They cost an upfront debit, profit if the stock moves favorably beyond the inner short strike by expiration, and have defined, limited risk like credit spreads.
These strategies offer alternatives to bull put spreads for directional, neutral, credit or debit structures based on market outlook.


Share


No Comments Yet