Explore Key Features of Strike Money
Unlock the full potential of the stock market with our user-friendly stock analysis tool. Elevate your trading with smart market analysis.
1.
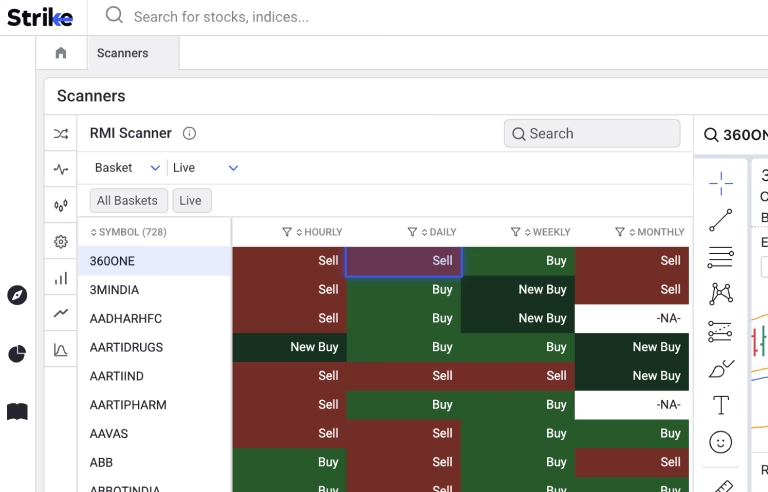
Scan, filter, and pick high-growth stocks effortlessly with intelligent stock screeners
Scanners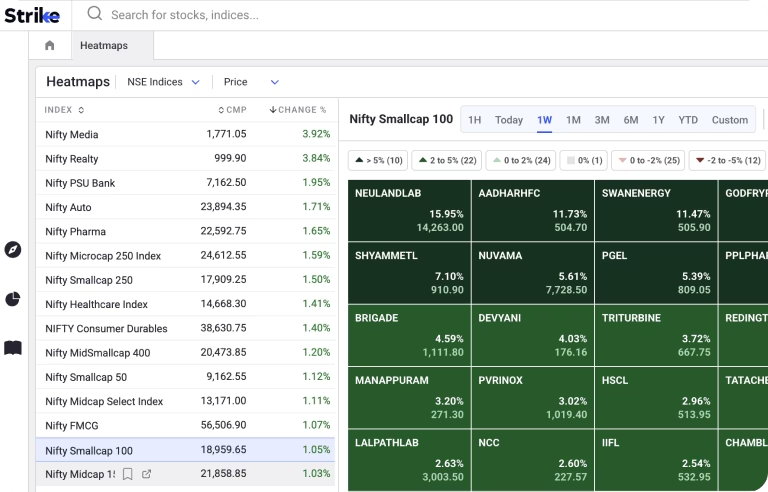
2.
Color-coded stock heatmaps simplify market analysis for better trading decisions
Heatmaps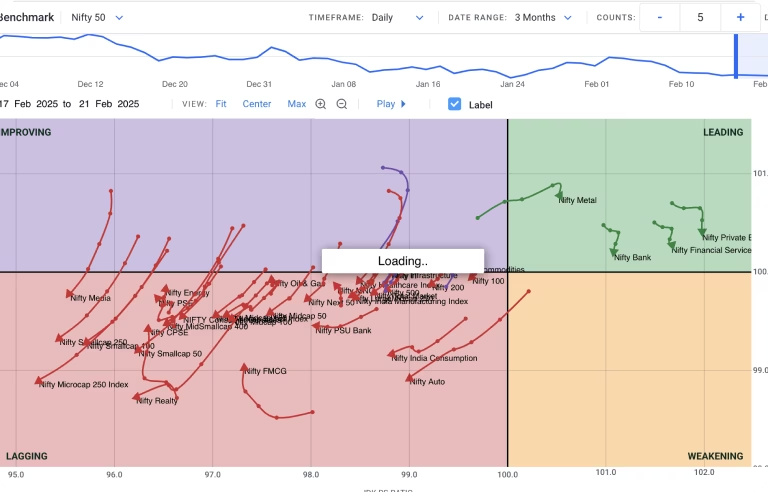
3.
Spot outperforming and underperforming sectors and stocks with rrg analysis
Relative Rotation Graph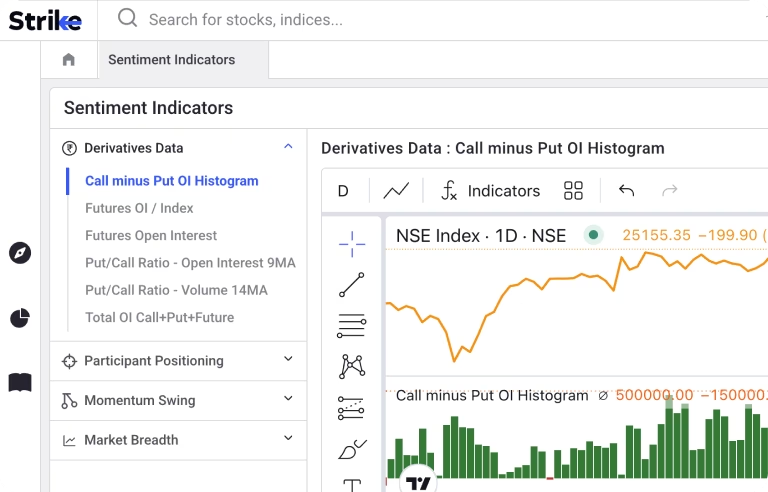
4.
Understand market emotions with data-backed decisions using sentiment analysis
Sentiment Indicator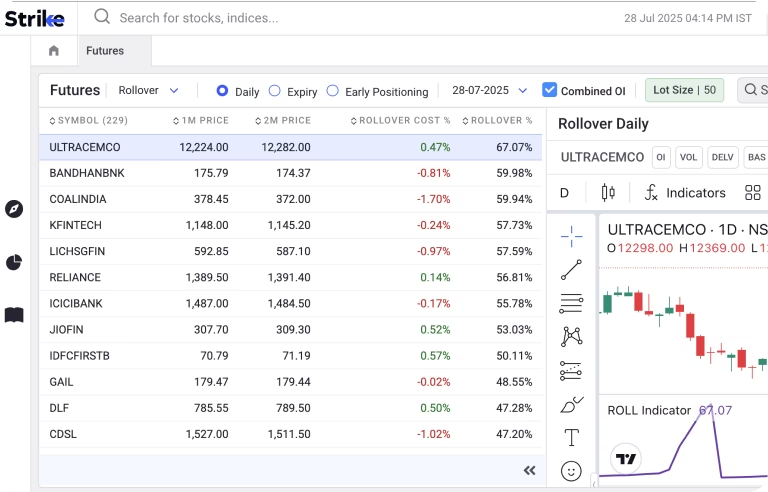
5.
Stay ahead with predictive trends, price movements with futures analysis tools
Futures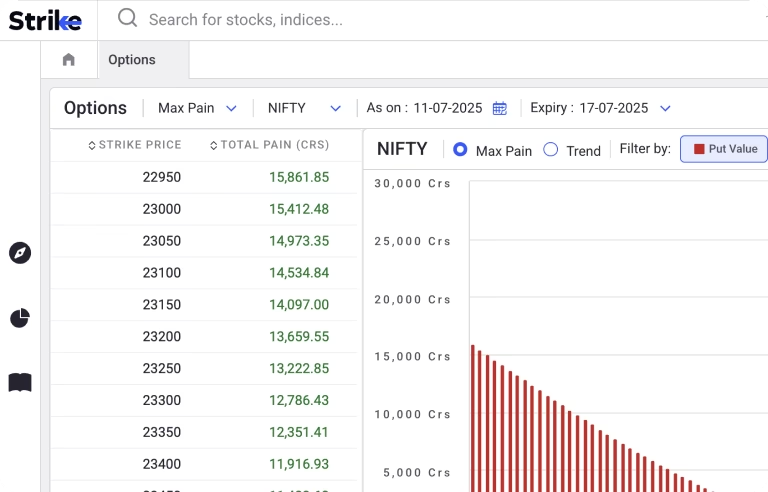
6.
Identify high-potential option trades instantly with smart options analysis tools
OptionsSee more Features

❤ Love in every
STRIKE
40k+
Users
200k+
Visitors
5k+
Stocks
100+
Indicators
FAQs
We're here to help with any questions you have about Strike Money
Why Use Strike Money for Stock Analysis?
Strike Money is a powerful stock analysis tool designed to provide investors with real-time market insights, advanced charting capabilities, and data-driven recommendations. It helps traders make informed decisions by offering technical indicators, trend analysis, and data-driven stock predictions. Whether you’re a beginner or an experienced investor, Strike Money simplifies the analysis process by presenting complex financial data in an easy-to-understand format.
Is Strike Money Free?
Strike Money offers a freemium model, meaning users can access basic stock analysis features without any cost, while premium features require a subscription. The free version typically includes essential tools such as real-time stock prices, fundamental data, and basic charting options. However, advanced functionalities like custom indicators, in-depth financial analysis, and exclusive screeners are often reserved for paid subscribers.
What is a Stock Analysis Tool?
A stock analysis tool is a digital platform that helps investors evaluate stocks using financial data, technical indicators, and market trends. These tools provide insights into stock performance, helping traders and investors make informed decisions. Stock analysis tools typically include features like price charts, earnings reports, fundamental ratios, and stock screeners to filter potential investment opportunities.
Why Use a Stock Analysis Tool?
Stock analysis tools enable investors to make data-driven decisions by providing comprehensive market insights and analytical features. Instead of manually sifting through financial statements and stock charts, these tools automate the process and present key metrics in a structured format. This allows traders to identify potential investments, assess risks, and track market trends efficiently.
How to Choose the Right Stock Analysis Tool
Selecting the right stock analysis tool depends on your trading style, budget, and feature requirements. For fundamental investors, platforms offering detailed financial reports, earnings analysis, and valuation metrics are ideal. Technical traders, on the other hand, should look for tools with advanced charting, technical indicators, and AI-driven trend predictions.
What is the Best Stock Analysis Website?
When it comes to selecting the best stock analysis website, Strike Money stands out as an innovative, all-in-one platform designed for both beginner and experienced investors. Unlike traditional stock research websites that overwhelm users with excessive data, Strike Money simplifies the process by providing data-driven insights, real-time market analysis, and easy-to-use financial tools. With its intuitive dashboard, traders can access technical indicators, fundamental stock analysis, and predictive models to stay ahead of market trends.


